Coronavirus disease 2019 (COVID-19) has become a pandemic. Retrospective data showed worse outcomes in patients with cardiovascular disease (CVD) and cardiovascular (CV) risk factors. Our aim was to evaluate the link between CVD and CV risk factors and in-hospital outcomes in COVID-19 patients.
MethodsWe designed a prospective registry that included consecutive COVID-19 patients admitted at our institution. The inclusion period was from 27 February to 7 April 2020. Clinical outcomes were monitored up to 2 May 2020.
ResultsA total of 876 patients were included. Mean age was 62±18 years old; 47% were > 65 years of age. A total of 69% of patients had at least one CV risk factor; 15% of the patients had previous history of CVD. Patients with previous CVD were significantly older (77±11 vs 60±18 years old; P<.01), with a higher proportion of men (64 vs 54%; P=.021) and showed a higher proportion of rise in both high-sensitivity cardiac-specific troponin-T (hs-cTnT) (78 vs 27%; P<.01) and N-terminal pro-B-type natriuretic peptide (NT-proBNP) (74 vs 29%; P<.01) on admission. Those patients with CV risk factors were also significantly older (68±16 vs 49±16 years old; P<.01), showing a higher percentage of patients fulfilling acute distress respiratory syndrome criteria (28 vs 21%; P=.021) and more need of mechanical ventilation (9 vs 4%; P<.01). Levels of hs-cTnT (44 vs 9%; P<.01) and NT-proBNP (43 vs 15%; P<.01) were more frequently elevated in patients with CV risk factors. Risk of death was significantly higher in patients with CVD (33 vs 8%; P<.01) or CV risk factors (16 vs 1%; P<.01). We found age > 65 years old (OR, 15; 95%CI, 5–43), chronic congestive heart failure (OR, 3.27; 95%CI, 1.38–7.72) and chronic kidney disease (OR, 8.55; 95%CI, 1.47–5.46) as independent predictors of death.
ConclusionsIn patients admitted for COVID-19, CVD or CV risk factors are associated with an increased risk of death during hospitalization. We found that older age, history of congestive heart failure and chronic kidney disease are independent predictors of death in COVID-19.
La enfermedad coronavírica de 2019 (COVID-19) se ha convertido en una pandemia. Datos de estudios retrospectivos han mostrado una peor evolución en pacientes con enfermedad cardiovascular (ECV) y factores de riesgo cardiovascular (FRCV). Nuestro objetivo fue evaluar la relación entre la ECV y los FRCV con la evolución hospitalaria de pacientes con COVID-19.
MétodosSe diseñó un registro prospectivo que incluyó a pacientes consecutivos con COVID-19 ingresados en nuestro centro hospitalario. El periodo de inclusión abarcó desde el 27 de febrero al 7 de abril de 2020. Se monitorizaron los eventos clínicos hasta el 2 de mayo de 2020.
ResultadosSe incluyó un total de 876 pacientes. La edad media fue de 62±18 años; un 47% fueron > 65 años. Un 69% de los pacientes tenían al menos un FRCV; un 15% tenían ECV previa. Aquellos pacientes con ECV fueron significativamente más mayores (77±11 frente a 60±18 años; p<0,01), con una mayor proporción de varones (64 frente a 54%; p=0,021) y mostraron en mayor proporción, en el momento del ingreso hospitalario, elevación de troponina T ultrasensible (hs-cTnT) (78 frente a 27%; p<0,01) y de fracción aminoterminal del propéptido natriurético cerebral tipo B (NT-proBNP) (74 frente a 29%; p<0,01). Aquellos pacientes con FRCV fueron significativamente más mayores (68±16 frente a 49±16 años; p<0,01), mostrando un mayor porcentaje de pacientes que cumplían criterios diagnósticos de síndrome de distrés respiratorio agudo (28 frente a 21%; p=0,021) y un mayor porcentaje de necesidad de ventilación mecánica invasiva (9 frente a 4%; p<0,01). Los pacientes con FRCV presentaron con mayor frecuencia elevación de los niveles de hs-cTnT (44 frente a 9%; p<0,01) y NT-proBNP (43 frente a 15%; p<0,01). El riesgo de muerte fue significativamente mayor en los pacientes con ECV (33 frente a 8%; p<0,01) o FRCV (16 frente a 1%; p<0,01). La edad > 65 años (OR=15; IC95%, 5-43), la insuficiencia cardiaca (OR=3,27; IC95%, 1,38-7,72) y la insuficiencia renal crónica (OR=8,55; IC95%, 1,47-5,46) fueron predictores independientes de mortalidad hospitalaria por COVID-19.
ConclusionesEn pacientes ingresados por COVID-19, la presencia de ECV o FRCV se asocia con un mayor riesgo de muerte durante la hospitalización. Una mayor edad, la historia de insuficiencia cardiaca y la insuficiencia renal crónica fueron predictores independientes de muerte por COVID-19.
Coronavirus disease 2019 (COVID-19), produced by a new type of coronavirus named severe acute respiratory syndrome coronavirus 2 (SARS-CoV-2), has become a pandemic. Since the first cases described in the Chinese city of Wuhan, province of Hubei, in December 2019, this pathogen has rapidly spread worldwide. Since 31 December 2019 and as of 2 August 2020, 17841669 cases of COVID-19 have been reported worldwide, including 685281 deaths.1 The high speed of expansion of this infection has led health-care systems of many countries to a situation close to collapse and to many governments to impose lockdown. Spain has become one of the countries more aggressively affected by this condition, with 288522 patients confirmed positive and 28445 related deaths.2 Although the main clinical manifestations of COVID-19 are respiratory, it has been described that some patients develop some degree of cardiovascular (CV) damage.3 In addition, data from retrospective cohorts of patients with COVID-19 described a tendency to a more aggressive disease and worse outcomes in patients with CV disease (CVD).3 We aimed to evaluate the link between CVD and CV risk factors and in-hospital outcomes from a prospective cohort of consecutive COVID-19 patients admitted at our institution.
MethodsStudy design and data collectionWe designed a prospective registry that included consecutive laboratory-confirmed COVID-19 patients admitted at our institution. The period of inclusion ranged from 27 February to 7 April 2020. Clinical outcomes were monitored up to 2 May 2020. Demographic characteristics (age and sex), clinical data (both CV and other significant comorbidities, laboratory findings, treatments, complications, and in-hospital outcomes) and results of cardiac examinations (electrocardiography and echocardiography) were collected from medical records and independently entered into a dedicated electronic database. A predefined laboratory test (including a complete blood count, coagulation tests, liver and renal function, electrolytes, C-reactive protein, procalcitonin, lactate dehydrogenase, creatine kinase, d-dimer, NT-proBNP and high-sensitivity cardiac-specific troponin-T (hs-cTnT) was performed on admission. Levels of NT-proBNP and hs-cTnT were measured thereafter if clinically indicated.
This study was performed according the Declaration of Helsinki, ISO 14155, and clinical practice guidelines. The study protocol was approved by the Institutional Ethics Committee and the hospitals’ research commissions of our institution. Written informed consent was waived in light of the urgent need to collect data.
Laboratory testsOnly laboratory-confirmed cases were included. A laboratory-confirmed COVID-19 was defined by a positive result on a reverse-transcriptase–polymerase-chain-reaction (RT-PCR) assay of a specimen collected on a nasopharyngeal swab. RT-PCR assays were performed according to World Health Organization interim guidance document.4
The electrochemiluminescence-based immunoanalytical system, Elecsys 2010 (Roche Diagnostics Ltd., Germany) was used to determine plasma levels of NT-proBNP and hs-cTnT. Hs-cTnT had a limit of detection of 5ng/L and a 99 percentile in the healthy population of 14.0ng/L. The manufacturer recommends a cut-off value for a positive test (for myocardial injury) of 14.0ng/L.5 For NT-proBNP, a level ≥ 300pg/mL on the acute setting was considered positive, following European Society of Cardiology recommendations.6
Study definitionsThe presence of CV risk factors was defined as the existence of at least one item among hypertension, hyperlipidemia, diabetes, history of smoking or obesity. CVD was defined as the presence of coronary artery disease, chronic congestive heart failure (CHF), valvular heart disease, atrial fibrillation/atrial flutter, stroke or peripheral artery disease. Cardiac injury was diagnosed if serum levels of hs-cTnT were above the 99 percentile upper reference limit, regardless of new electrocardiographic or echocardiographic abnormalities, according to the Fourth Universal Definition of Myocardial Infarction.7 Acute respiratory distress syndrome (ARDS) was diagnosed according to the Berlin criteria as acute-onset hypoxemia (ratio of arterial oxygen partial pressure to fractional inspired oxygen expressed as a fraction [PaO2/FiO2]<300) associated with bilateral pulmonary opacities on chest imaging that were not fully explained by CHF or other forms of volume overload.8
Statistical analysisQuantitative variables are presented as mean±standard deviation or median [interquartile range]. Categorical variables are presented as number (percentage). The Student t test or the Mann–Whitney U were used to compare continuous variables. Pearson's chi-square test was used for categorical variables.
We designed a multivariable model to find independent predictors of death during hospitalization. To build this model, we analyzed a total of 19 independent variables using a bivariate logistic regression analysis. We included age > 65 years old, sex, CV risk factor (hypertension, hyperlipidemia, diabetes mellitus, smoking habit, obesity), CVD and other significant comorbidities (chronic kidney disease (CKD) – defined as a glomerular filtration rate < 60mL/min per 1.73m2, chronic obstructive pulmonary disease (COPD), bronchial asthma and history of previous cancer). We included other 2 variables, active treatment with angiotensin-converting enzyme inhibitors (ACEIs) or angiotensin receptor blockers (ARBs), based on previous studies describing their potential role on SARS-CoV-2 mechanisms of infection. For the selection of variables, we used a generous threshold of P<.1 to determine statistical significance to ensure that we did not drop any potentially relevant variable from the final model. Overfitting of the multivariable model was ruled-out on the basis of McFadden's pseudo R-squared values and cross-validation method. For the rest of the test, a value of P<.05 was considered statistically significant. All tests were performed with STATA 12 (StataCorp LLC, United States).
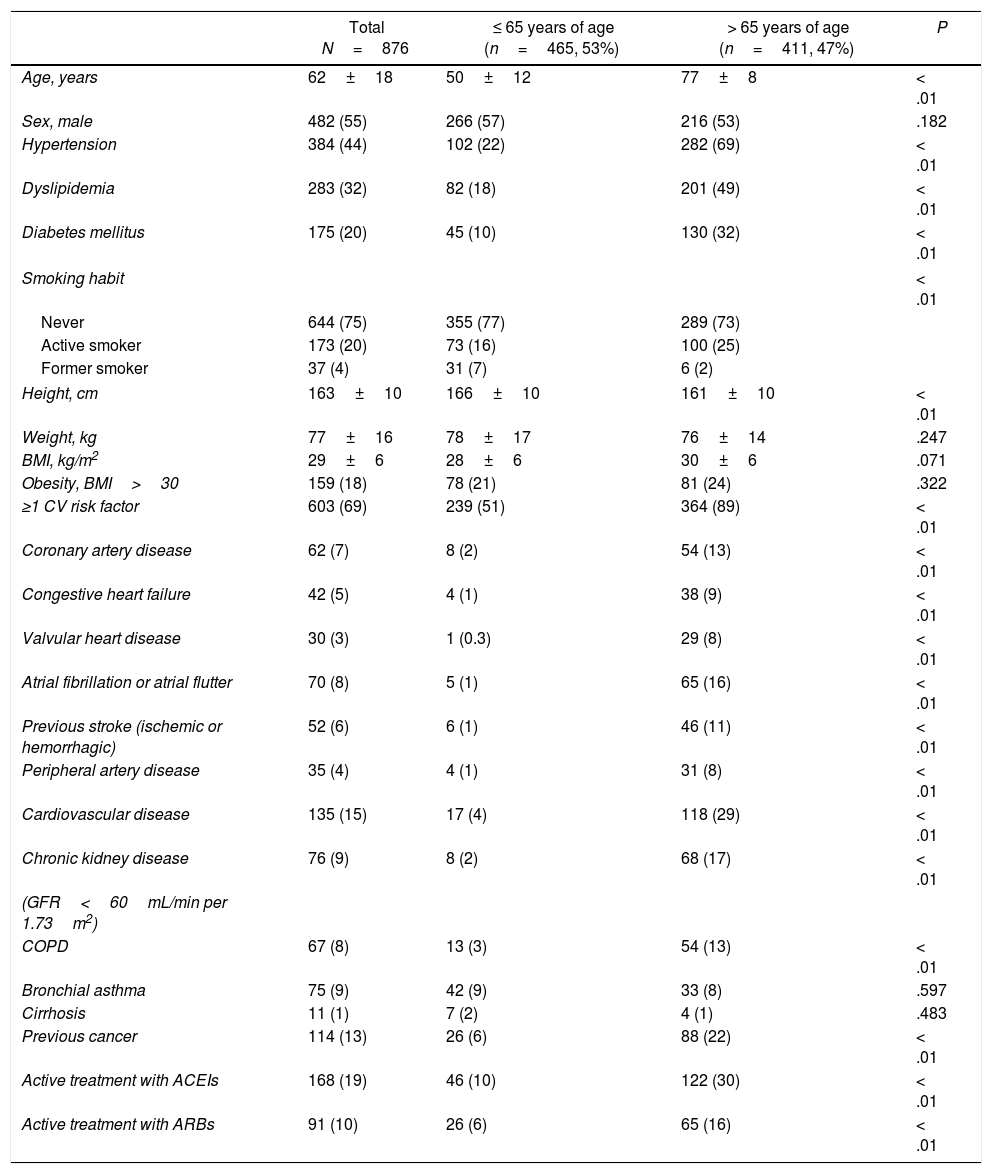
ResultsFrom February 27 to April 7 2020, a total of 876 consecutive patients were included. Baseline characteristics of this population are summarized in Table 1. Mean age was 62±18 years old, men represented 55% of patients included. Almost half of the patients (47%) were > 65 years of age. Fig. 1 shows the distribution of age of the patients included. Sixty-nine percent of patients presented at least one CV risk factor, being hypertension (44%) and hyperlipidemia (32%) the more prevalent. The history of smoking (24%), presence of diabetes (20%) or obesity (18%) were less frequent in our cohort. A total of 15% percent of the patients had previous history of CVD. Among them, 7% had coronary artery disease, 5% CHF, 3% significant valvular heart disease and 8% history of atrial fibrillation or atrial flutter. Other important comorbidities, as CKD (9%) or respiratory disease — COPD in 8% and bronchial asthma in 9% were relatively frequent.
Baseline characteristics.
| Total N=876 | ≤ 65 years of age (n=465, 53%) | > 65 years of age (n=411, 47%) | P | |
|---|---|---|---|---|
| Age, years | 62±18 | 50±12 | 77±8 | < .01 |
| Sex, male | 482 (55) | 266 (57) | 216 (53) | .182 |
| Hypertension | 384 (44) | 102 (22) | 282 (69) | < .01 |
| Dyslipidemia | 283 (32) | 82 (18) | 201 (49) | < .01 |
| Diabetes mellitus | 175 (20) | 45 (10) | 130 (32) | < .01 |
| Smoking habit | < .01 | |||
| Never | 644 (75) | 355 (77) | 289 (73) | |
| Active smoker | 173 (20) | 73 (16) | 100 (25) | |
| Former smoker | 37 (4) | 31 (7) | 6 (2) | |
| Height, cm | 163±10 | 166±10 | 161±10 | < .01 |
| Weight, kg | 77±16 | 78±17 | 76±14 | .247 |
| BMI, kg/m2 | 29±6 | 28±6 | 30±6 | .071 |
| Obesity, BMI>30 | 159 (18) | 78 (21) | 81 (24) | .322 |
| ≥1 CV risk factor | 603 (69) | 239 (51) | 364 (89) | < .01 |
| Coronary artery disease | 62 (7) | 8 (2) | 54 (13) | < .01 |
| Congestive heart failure | 42 (5) | 4 (1) | 38 (9) | < .01 |
| Valvular heart disease | 30 (3) | 1 (0.3) | 29 (8) | < .01 |
| Atrial fibrillation or atrial flutter | 70 (8) | 5 (1) | 65 (16) | < .01 |
| Previous stroke (ischemic or hemorrhagic) | 52 (6) | 6 (1) | 46 (11) | < .01 |
| Peripheral artery disease | 35 (4) | 4 (1) | 31 (8) | < .01 |
| Cardiovascular disease | 135 (15) | 17 (4) | 118 (29) | < .01 |
| Chronic kidney disease | 76 (9) | 8 (2) | 68 (17) | < .01 |
| (GFR<60mL/min per 1.73m2) | ||||
| COPD | 67 (8) | 13 (3) | 54 (13) | < .01 |
| Bronchial asthma | 75 (9) | 42 (9) | 33 (8) | .597 |
| Cirrhosis | 11 (1) | 7 (2) | 4 (1) | .483 |
| Previous cancer | 114 (13) | 26 (6) | 88 (22) | < .01 |
| Active treatment with ACEIs | 168 (19) | 46 (10) | 122 (30) | < .01 |
| Active treatment with ARBs | 91 (10) | 26 (6) | 65 (16) | < .01 |
ACEIs, angiotensin-converting enzyme inhibitors; ARBs, angiotensin receptor blockers; BMI, body mass index; COPD, chronic obstructive pulmonary disease; GFR, glomerular filtration rate.
Data are expressed as n (%), mean±SD.
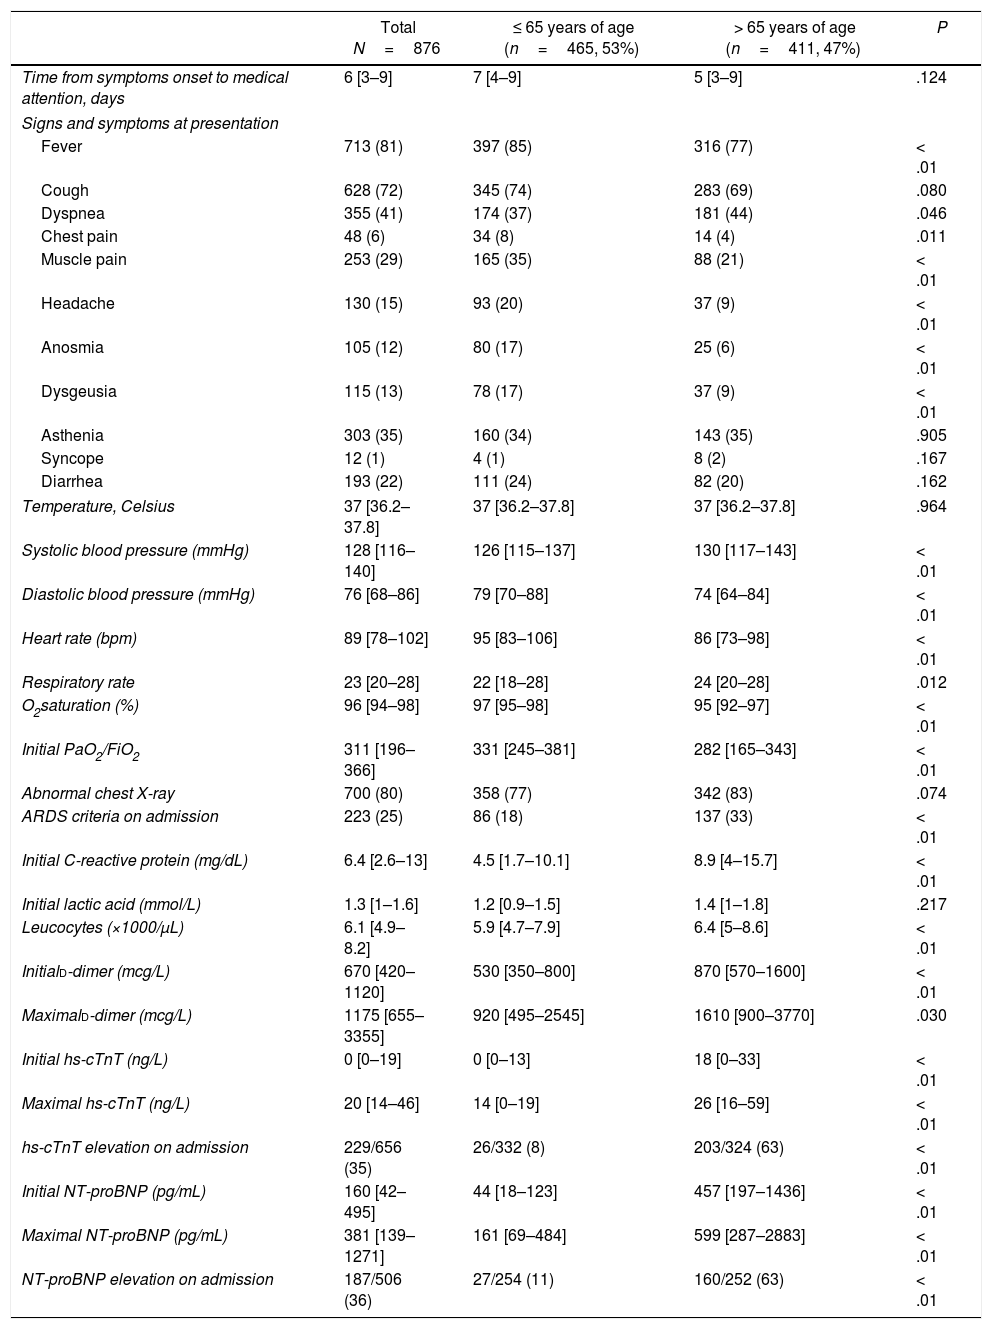
Characteristics at hospital presentation and result of laboratory tests are summarized in Table 2. At presentation, the more frequent sign was the presence of fever (81%), followed by symptoms of cough (72%), dyspnea (41%) and asthenia (35%). Other common symptoms were muscular pain (29%) or diarrhea (22%). Previously described symptoms suggesting SARS-CoV-2 infection as anosmia (12%) or dysgeusia (13%) were relatively unusual in our cohort. A majority of patients (80%) had an abnormal chest X-ray on admission, with one fourth of patients fulfilling criteria of ARDS on admission. Of those patients tested for hs-cTnT and NT-proBNP, 35 and 36% respectively, showed elevated levels of these biomarkers on admission.
Characteristics at presentation and laboratory test results.
| Total N=876 | ≤ 65 years of age (n=465, 53%) | > 65 years of age (n=411, 47%) | P | |
|---|---|---|---|---|
| Time from symptoms onset to medical attention, days | 6 [3–9] | 7 [4–9] | 5 [3–9] | .124 |
| Signs and symptoms at presentation | ||||
| Fever | 713 (81) | 397 (85) | 316 (77) | < .01 |
| Cough | 628 (72) | 345 (74) | 283 (69) | .080 |
| Dyspnea | 355 (41) | 174 (37) | 181 (44) | .046 |
| Chest pain | 48 (6) | 34 (8) | 14 (4) | .011 |
| Muscle pain | 253 (29) | 165 (35) | 88 (21) | < .01 |
| Headache | 130 (15) | 93 (20) | 37 (9) | < .01 |
| Anosmia | 105 (12) | 80 (17) | 25 (6) | < .01 |
| Dysgeusia | 115 (13) | 78 (17) | 37 (9) | < .01 |
| Asthenia | 303 (35) | 160 (34) | 143 (35) | .905 |
| Syncope | 12 (1) | 4 (1) | 8 (2) | .167 |
| Diarrhea | 193 (22) | 111 (24) | 82 (20) | .162 |
| Temperature, Celsius | 37 [36.2–37.8] | 37 [36.2–37.8] | 37 [36.2–37.8] | .964 |
| Systolic blood pressure (mmHg) | 128 [116–140] | 126 [115–137] | 130 [117–143] | < .01 |
| Diastolic blood pressure (mmHg) | 76 [68–86] | 79 [70–88] | 74 [64–84] | < .01 |
| Heart rate (bpm) | 89 [78–102] | 95 [83–106] | 86 [73–98] | < .01 |
| Respiratory rate | 23 [20–28] | 22 [18–28] | 24 [20–28] | .012 |
| O2saturation (%) | 96 [94–98] | 97 [95–98] | 95 [92–97] | < .01 |
| Initial PaO2/FiO2 | 311 [196–366] | 331 [245–381] | 282 [165–343] | < .01 |
| Abnormal chest X-ray | 700 (80) | 358 (77) | 342 (83) | .074 |
| ARDS criteria on admission | 223 (25) | 86 (18) | 137 (33) | < .01 |
| Initial C-reactive protein (mg/dL) | 6.4 [2.6–13] | 4.5 [1.7–10.1] | 8.9 [4–15.7] | < .01 |
| Initial lactic acid (mmol/L) | 1.3 [1–1.6] | 1.2 [0.9–1.5] | 1.4 [1–1.8] | .217 |
| Leucocytes (×1000/μL) | 6.1 [4.9–8.2] | 5.9 [4.7–7.9] | 6.4 [5–8.6] | < .01 |
| Initiald-dimer (mcg/L) | 670 [420–1120] | 530 [350–800] | 870 [570–1600] | < .01 |
| Maximald-dimer (mcg/L) | 1175 [655–3355] | 920 [495–2545] | 1610 [900–3770] | .030 |
| Initial hs-cTnT (ng/L) | 0 [0–19] | 0 [0–13] | 18 [0–33] | < .01 |
| Maximal hs-cTnT (ng/L) | 20 [14–46] | 14 [0–19] | 26 [16–59] | < .01 |
| hs-cTnT elevation on admission | 229/656 (35) | 26/332 (8) | 203/324 (63) | < .01 |
| Initial NT-proBNP (pg/mL) | 160 [42–495] | 44 [18–123] | 457 [197–1436] | < .01 |
| Maximal NT-proBNP (pg/mL) | 381 [139–1271] | 161 [69–484] | 599 [287–2883] | < .01 |
| NT-proBNP elevation on admission | 187/506 (36) | 27/254 (11) | 160/252 (63) | < .01 |
ARDS, acute distress respiratory syndrome, hs-cTnT, high-sensitivity cardiac-specific troponin-T; NT-proBNP, N-terminal pro-B-type natriuretic peptide.
Data are expressed as n (%), mean±SD or median [IQR].
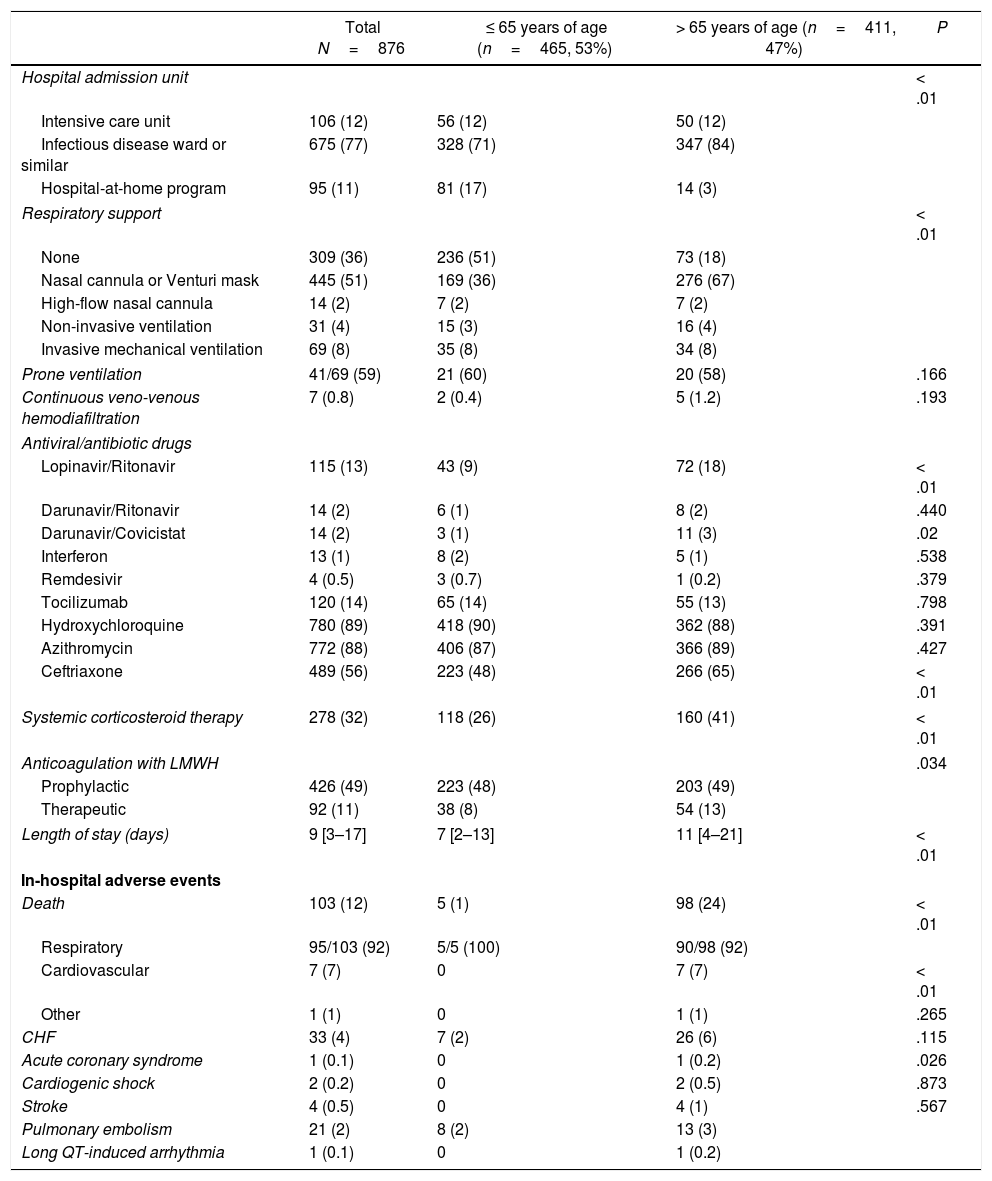
The description of management and hospital outcomes of the patients included is summarized in Table 3. A total of 106 patients (12%) required admission to intensive care unit (ICU) of our institution. From the total cohort, almost 2/3 (64%) required some degree of oxygen therapy, with 69 patients (8%) requiring invasive mechanical ventilation. There were no differences in the need for mechanical ventilation between older (age>65 years) and younger patients (8.3 vs 7.5%; P=.683). Of the subgroup of patients that required mechanical ventilation, 41 patients (59%) needed prone ventilation. Regarding medical treatment, the drugs more often used were hydroxychloroquine (89%), azithromycin (88%) and ceftriaxone (56%). The drug combination of lopinavir-ritonavir (13%) or tocilizumab (14%) were also quite frequently used. Only 4 patients were treated with remdesivir. Almost one third (32%) of patients received systemic corticosteroid therapy, and 60% received anticoagulation with low-molecular weight heparin (49% receiving prophylactic doses and 11% receiving therapeutic doses). Median length of stay was 9 days [IQR 3–17]. A total of 103 patients (12%) died during admission. In a vast majority of cases (92%) the cause of death was respiratory, with only 7 patients dying from CV causes. In our cohort, CV complications were relatively infrequent, with 33 patients (4%) developing CHF and 21 patients (2%) having pulmonary embolism. Only 1 patient developed drug-induced long-QT ventricular arrhythmia.
Management and hospital outcomes.
| Total N=876 | ≤ 65 years of age (n=465, 53%) | > 65 years of age (n=411, 47%) | P | |
|---|---|---|---|---|
| Hospital admission unit | < .01 | |||
| Intensive care unit | 106 (12) | 56 (12) | 50 (12) | |
| Infectious disease ward or similar | 675 (77) | 328 (71) | 347 (84) | |
| Hospital-at-home program | 95 (11) | 81 (17) | 14 (3) | |
| Respiratory support | < .01 | |||
| None | 309 (36) | 236 (51) | 73 (18) | |
| Nasal cannula or Venturi mask | 445 (51) | 169 (36) | 276 (67) | |
| High-flow nasal cannula | 14 (2) | 7 (2) | 7 (2) | |
| Non-invasive ventilation | 31 (4) | 15 (3) | 16 (4) | |
| Invasive mechanical ventilation | 69 (8) | 35 (8) | 34 (8) | |
| Prone ventilation | 41/69 (59) | 21 (60) | 20 (58) | .166 |
| Continuous veno-venous hemodiafiltration | 7 (0.8) | 2 (0.4) | 5 (1.2) | .193 |
| Antiviral/antibiotic drugs | ||||
| Lopinavir/Ritonavir | 115 (13) | 43 (9) | 72 (18) | < .01 |
| Darunavir/Ritonavir | 14 (2) | 6 (1) | 8 (2) | .440 |
| Darunavir/Covicistat | 14 (2) | 3 (1) | 11 (3) | .02 |
| Interferon | 13 (1) | 8 (2) | 5 (1) | .538 |
| Remdesivir | 4 (0.5) | 3 (0.7) | 1 (0.2) | .379 |
| Tocilizumab | 120 (14) | 65 (14) | 55 (13) | .798 |
| Hydroxychloroquine | 780 (89) | 418 (90) | 362 (88) | .391 |
| Azithromycin | 772 (88) | 406 (87) | 366 (89) | .427 |
| Ceftriaxone | 489 (56) | 223 (48) | 266 (65) | < .01 |
| Systemic corticosteroid therapy | 278 (32) | 118 (26) | 160 (41) | < .01 |
| Anticoagulation with LMWH | .034 | |||
| Prophylactic | 426 (49) | 223 (48) | 203 (49) | |
| Therapeutic | 92 (11) | 38 (8) | 54 (13) | |
| Length of stay (days) | 9 [3–17] | 7 [2–13] | 11 [4–21] | < .01 |
| In-hospital adverse events | ||||
| Death | 103 (12) | 5 (1) | 98 (24) | < .01 |
| Respiratory | 95/103 (92) | 5/5 (100) | 90/98 (92) | |
| Cardiovascular | 7 (7) | 0 | 7 (7) | < .01 |
| Other | 1 (1) | 0 | 1 (1) | .265 |
| CHF | 33 (4) | 7 (2) | 26 (6) | .115 |
| Acute coronary syndrome | 1 (0.1) | 0 | 1 (0.2) | .026 |
| Cardiogenic shock | 2 (0.2) | 0 | 2 (0.5) | .873 |
| Stroke | 4 (0.5) | 0 | 4 (1) | .567 |
| Pulmonary embolism | 21 (2) | 8 (2) | 13 (3) | |
| Long QT-induced arrhythmia | 1 (0.1) | 0 | 1 (0.2) | |
CHF, congestive heart failure; LMWH, low-molecular-weight heparin.
Data are expressed as n (%), mean±SD or median [IQR].
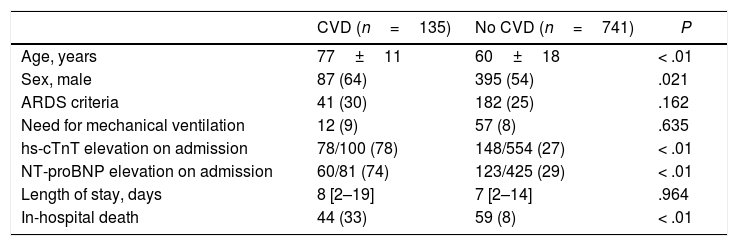
The comparison between patients with and without CVD and CV risk factors are summarized in Table 4 and Table 5. Those patients with previous CVD were significantly older (77±11 vs 60±18 years old; P<.01), with a higher proportion of men (64 vs 54%; P=.021). The group of patients with CVD showed a higher proportion of rise in both hs-cTnT (78 vs 27%; P<.01) and NT-proBNP (74 vs 29%; P<.01) levels on admission. Risk of death was significantly higher in patients with CVD (33 vs 8%; P<.01). Those patients with CV risk factors were also significantly older (68±16 vs 49±16 years old; P<.01) with no differences between sex. This last group showed a higher percentage of patients fulfilling ARDS criteria (28 vs 21%; P=.021) and more need of mechanical ventilation (9 vs 4%; P<.01). Levels of hs-cTnT (44 vs 9%; P<.01) and NT-proBNP (43 vs 15%; P<.01) on admission were more frequently elevated in those patients with CV risk factors. In-hospital mortality was also higher in this subgroup (16 vs 1%; P<.01). Fig. 2 shows Kaplan–Meier curves stratified by presence and number of CV risk factors, confirming a significant trend to higher mortality in patients with a greater number of CV risk factors. Fig. 3 shows Kaplan–Meier curves stratified by age and the presence of CVD or CV risk factors. As the figure illustrates, older patients with CVD or CV risk factors had a higher risk of death during admission; followed by the group of older patients without CVD or CV risk factors. There were no differences in mortality in young patients with and without CVD or CV risk factors.
Comparison between patients with and without CVD.
| CVD (n=135) | No CVD (n=741) | P | |
|---|---|---|---|
| Age, years | 77±11 | 60±18 | < .01 |
| Sex, male | 87 (64) | 395 (54) | .021 |
| ARDS criteria | 41 (30) | 182 (25) | .162 |
| Need for mechanical ventilation | 12 (9) | 57 (8) | .635 |
| hs-cTnT elevation on admission | 78/100 (78) | 148/554 (27) | < .01 |
| NT-proBNP elevation on admission | 60/81 (74) | 123/425 (29) | < .01 |
| Length of stay, days | 8 [2–19] | 7 [2–14] | .964 |
| In-hospital death | 44 (33) | 59 (8) | < .01 |
ARDS, acute respiratory distress syndrome; hs-cTnT, high-sensitivity cardiac-specific troponin-T; NT-proBNP, N-terminal pro-B-type natriuretic peptide.
Data are expressed as n (%), mean±SD or median [IQR].
Comparison between patients with and without CV risk factors.
| CV risk factors (n=603) | No CV risk factor (n=273) | P | |
|---|---|---|---|
| Age, years | 68±16 | 49±16 | < .01 |
| Sex, male | 333 (55) | 149 (55) | .951 |
| ARDS criteria | 167 (28) | 56 (21) | .021 |
| Need for mechanical ventilation | 57 (9) | 12 (4) | < .01 |
| hs-cTnT elevation on admission | 210/472 (44) | 16/182 (9) | < .01 |
| NT-proBNP elevation on admission | 164/383 (43) | 19/123 (15) | < .01 |
| Length of stay (days) | 8 [3–17] | 6 [1–11] | .207 |
| In-hospital death | 99 (16) | 4 (1) | < .01 |
ARDS, acute respiratory distress syndrome; hs-cTnT, high-sensitivity cardiac-specific troponin-T; NT-proBNP, N-terminal pro-B-type natriuretic peptide.
Data are expressed as n (%), mean±SD or median [IQR].
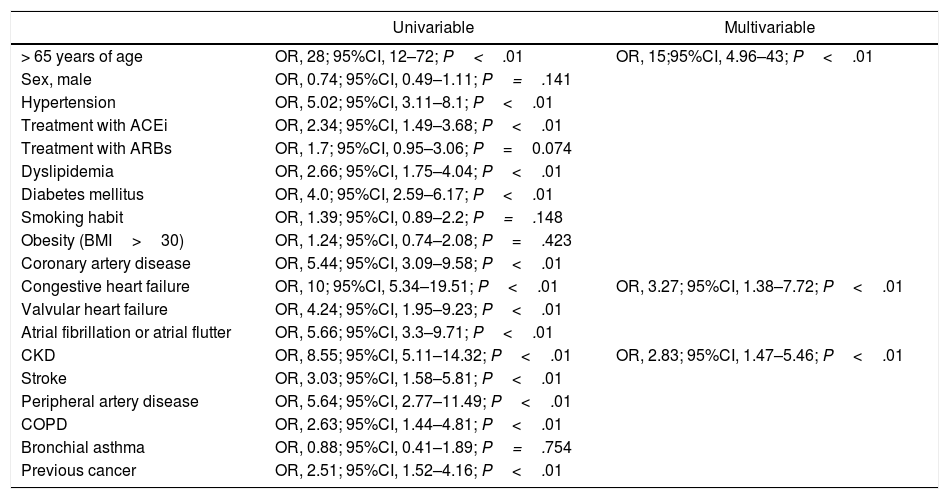
The analysis of predictors of death during admission is shown in Table 6. We found that age over 65 (OR 15; 95%CI, 5–43), CHF (OR 3.27; 95%CI, 1.38–7.72) and CKD (OR, 8.55; 95%CI, 1.47–5.46) were independent predictors of death in our cohort.
Analysis of predictors of death.
| Univariable | Multivariable | |
|---|---|---|
| > 65 years of age | OR, 28; 95%CI, 12–72; P<.01 | OR, 15;95%CI, 4.96–43; P<.01 |
| Sex, male | OR, 0.74; 95%CI, 0.49–1.11; P=.141 | |
| Hypertension | OR, 5.02; 95%CI, 3.11–8.1; P<.01 | |
| Treatment with ACEi | OR, 2.34; 95%CI, 1.49–3.68; P<.01 | |
| Treatment with ARBs | OR, 1.7; 95%CI, 0.95–3.06; P=0.074 | |
| Dyslipidemia | OR, 2.66; 95%CI, 1.75–4.04; P<.01 | |
| Diabetes mellitus | OR, 4.0; 95%CI, 2.59–6.17; P<.01 | |
| Smoking habit | OR, 1.39; 95%CI, 0.89–2.2; P=.148 | |
| Obesity (BMI>30) | OR, 1.24; 95%CI, 0.74–2.08; P=.423 | |
| Coronary artery disease | OR, 5.44; 95%CI, 3.09–9.58; P<.01 | |
| Congestive heart failure | OR, 10; 95%CI, 5.34–19.51; P<.01 | OR, 3.27; 95%CI, 1.38–7.72; P<.01 |
| Valvular heart failure | OR, 4.24; 95%CI, 1.95–9.23; P<.01 | |
| Atrial fibrillation or atrial flutter | OR, 5.66; 95%CI, 3.3–9.71; P<.01 | |
| CKD | OR, 8.55; 95%CI, 5.11–14.32; P<.01 | OR, 2.83; 95%CI, 1.47–5.46; P<.01 |
| Stroke | OR, 3.03; 95%CI, 1.58–5.81; P<.01 | |
| Peripheral artery disease | OR, 5.64; 95%CI, 2.77–11.49; P<.01 | |
| COPD | OR, 2.63; 95%CI, 1.44–4.81; P<.01 | |
| Bronchial asthma | OR, 0.88; 95%CI, 0.41–1.89; P=.754 | |
| Previous cancer | OR, 2.51; 95%CI, 1.52–4.16; P<.01 |
Those variables with P<.1 in the univariate analysis were included in the model for multivariable analysis. ACEIs: angiotensin-converting enzyme inhibitors; ARBs: angiotensin receptor blockers; BMI: body mass index; CKD: chronic kidney disease; COPD: chronic obstructive pulmonary disease; OR; odd ratio CI: confidence interval.
With data from a prospective cohort of consecutive patients admitted by COVID-19 infection in our center, we found that (a) patients with previous established CVD or CV risk factors have a higher risk of death during admission by COVID-19; (b) the impact of CV risk factors on mortality in COVID-19 seems to be accumulative, as patients with a greater number of CV risk factors showed higher risk of mortality; (c) there is a relevant interaction between age and CVD and CV risk factors in the context of SARS-CoV-2 infection. The presence of CVD or CV risk factors is not associated with worse outcomes in younger patients with COVID-19 in our cohort. However, in older patients, the presence of CVD or CV risk factors identify a subgroup of patients with high mortality; (d) age>65 years old, previous history of CHF and CKD are independent predictors of in-hospital mortality in COVID-19.
CVD and CV risk factorsPrevious observational data described worse outcomes in patients with CVD and COVID-19 infection. Guo et al. described a higher mortality in patients with CVD (including hypertension, coronary artery disease and cardiomyopathy) compared to those without CVD in 187 COVID-19 patients in China.9 Li et al. found a higher prevalence of hypertension, diabetes and CVD among severe COVID-19 patients admitted to the ICU compared with those admitted to non-ICU units.10 In our cohort, those patients with CVD or CV risk factors had a significantly higher risk of death during hospitalization. Furthermore, those patients with CVD or CV risk factors more frequently showed elevated cardiac biomarkers (both hs-cTnT and NT-proBNP) on admission. Recently, Guo et al. described a higher risk of death in patients with CVD and associated myocardial injury (evaluated by elevation of troponin T) among 187 patients with COVID-19.9 Although the mechanisms of cardiac injury of SARS-CoV-2 remain not fully understood, several potential mechanisms have been proposed, including direct myocardial damage by the virus, systemic inflammatory response to infection or indirect damage induced by hypoxia.9 Whether worse outcomes in patients with CVD are mediated by this mostly subclinical cardiac injury remains unknown. On the other hand, most CVD components and CV risk factors failed to show an independent relationship with in-hospital death, with only CHF appearing as an independent predictor. This can be explained by baseline differences between groups of patients with/without CVD and CV risk factors. In our study, patients with CVD and CV risk factors were significantly older. The age difference may explain the increased risk found in these subgroups. With this in mind, we would better consider the presence of CVD and CV risk factors as a risk marker. Furthermore, as Fig. 3 illustrates, it seems that there is an interaction between age and CVD or CV risk factors. The presence of CVD or CV risk factors was not associated with worse outcomes in younger patients. On the contrary, the presence of CVD or CV risk factors in older patients identifies a subgroup with particularly poor prognosis in COVID-19.
Heart failure and SARS-CoV-2Infections are a frequent cause of hospitalization in patients with CHF. Alon et al. described respiratory infections as the most frequent focus of infection in patients with CHF.11 Furthermore, infectious-related admissions, compared with other reasons for admission, seem to be associated with an increased 30-day mortality in patients with CHF.11 Moreover, in our cohort, previous history of CHF was higher (5 vs 1%) than in previous reports regarding other coronaviruses like Middle East respiratory syndrome coronavirus (MERS-CoV).12
Role of ACEIs and ARBsThe linkage between ACEIs/ARBs and COVID-19 is based on the association between angiotensin-converting enzyme 2 (ACE2) and coronaviruses like SARS-CoV-1 and SARS-CoV-2.13,14 In these viruses, ACE2 acts as a co-receptor for viral entry in the cell. Initial reports of case series from China reported a higher risk of ARDS and death in patients with hypertension.15,16 These early data raised concern about a possible harmfull effect of ACEIs/ARBs in patients with COVID-19. Several scientific societies, like the Council on Hypertension of the European Society of Cardiology, promptly replied arguing that there was no scientific evidence to suggest that treatment with ACEIs or ARBs should be discontinued in patients with COVID-19. In our study, both ACEIs and ARBs failed to show an independent relationship with an increased risk of death in COVID-19 patients, reassuring about the safety of these therapies in the context of SARS-CoV-2 infection.
Mortality in COVID-19Initial reports described a higher risk of death during admission by COVID-19 infection. Zhou et al. described 54 deaths among 191 patients with COVID-19 (28%) admitted at 2 hospitals in Wuhan.15 Similarly, Wu et al. described 44 deaths among the 201 COVID-19 patients (22%) admitted at 1 institution in Wuhan.16 In our cohort 103 patients (12%) died during the initial admission. As age has been systematically found as a strong predictor of death in COVID-19, differences in mortality might be explained by differences in age between different cohorts. However, in our cohort, mean age was considerably old (62 years old) and very similar to previous data on retrospective cohorts.
LimitationsOur work has several limitations that deserve discussion. First of all, due to its observational non-randomized design, we cannot exclude the presence of potential confounders that were not identified. Secondly, despite our protocol included the measurement of both hs-cTnT and NT-proBNP levels at the time of admission, only 75% of patients for hs-cTnT and 58% of patients for NT-proBNP were finally evaluated. Therefore, this may constitute a cause of uncontrolled selection bias. Thirdly, the role of age in the prognosis of COVID-19 may also be a matter of debate. Even if it seems clear that older patients have a worse prognosis in COVID-19, part of this poorer outcomes may be linked to less access of these patients to some therapies that might reduce mortality, as might be the case for mechanical ventilation or new drugs. Although in our cohort, we found no differences between older and younger patients in the indication of mechanical ventilation, we cannot exclude that some older patients with aggressive disease were not selected for mechanical ventilation based on opportunity cost criteria in a situation where healthcare system was on the verge of collapse. Fourthly, most patients in our study required hospital admission. Only a group representing 10% of the total cohort was managed in a hospital-at-home program without hospital admission. Furthermore, milder cases without respiratory compromise and with only minor symptoms may have been managed as outpatients by general practitioners and are not well represented in our cohort.
ConclusionsIn patients admitted with COVID-19, the presence of CVD or CV risk factors is associated with an increased risk of death during hospitalization. We found that older age, history of CHF and CKD are independent predictors of death in COVID-19 patients.
COVID-19 is an infection that has spread rapidly worldwide. Data from retrospective registries described a potential link between the presence of CVD and CV risk factors with worse outcomes in COVID-19 patients.
Does it contribute with anything new?Our prospective data confirm that patients with CVD or CV risk factors have a higher risk of death during admission for COVID-19. The role of CV risk factors on mortality is accumulative (patients with a greater number of CV risk factors showed higher risk of mortality). The presence of CVD or CV risk factors is not associated with worse outcomes in young patients. In older patients, the presence of CVD or CV risk factors identify a high-risk subgroup. We found that age > 65 years old, previous history of CHF and CKD are independent predictors of in-hospital mortality in COVID-19 patients.
This project received no financial assistance.
Conflicts of interestThe authors declare that they have no conflicts of interest.
We would like to thank Isabel Cirera and Julio Pascual for their support and enthusiasm in the development of the project. We also thank Cristina Soler, Paula Cabero, Andrea Sanchez, Cristina Tevar, Yolanda Bartolomé, Camino Fernandez and María Ángeles Miralles for their help with data acquisition and administrative support.


