


For years, there has been an increase in cases of atrial fibrillation, reaching alarming levels. This is why intense work is done to find predictors of this arrhythmia. The electrocardiogram has shown to be useful for this purpose, and multiple indices derived from the P wave have been developed. Among the most notable is the P wave dispersion (PWD). It has been verified that PWD can predict the occurrence of paroxysmal atrial fibrillation in the absence of diseases as well as in the context of multiple cardiovascular pathologies or other systems. PWD is considered by most researchers to be the result of inhomogeneous conduction of the atrial electrical impulse, but a vector explanation may play a role in its genesis. The large body of evidence surrounding PWD supports its use in clinical practice.
Desde hace años se han incrementado los casos de fibrilación auricular, alcanzándose niveles alarmantes, por lo que se trabaja intensamente en la búsqueda de predictores de esta arritmia. El electrocardiograma ha mostrado ser útil con este fin, y se han desarrollado múltiples índices derivados de la onda P. Entre los más notables se encuentra la dispersión de la onda P (Pd). Se ha comprobado que la Pd puede predecir la ocurrencia de fibrilación auricular paroxística tanto en ausencia de enfermedades como en el contexto de múltiples patologías cardiovasculares o de otros sistemas. La mayoría de los investigadores consideran que la Pd es el resultado de la conducción no homogénea del impulso eléctrico auricular, pero una explicación vectorial podría jugar un rol en su génesis. La amplia evidencia científica sobre la Pd avala su uso en la práctica clínica.
Atrial fibrillation (AF) is the most frequently diagnosed sustained tachyarrhythmia. In the United States, a prevalence ranging from 2.7–6.1 million in 2010 to a predicted value of 12.1 million by 2030 has been estimated.1 In Europe, AF affects 8 million people and it is expected an increase of up to 18 million in the year 2060.2 The frequent asymptomatic character of this arrhythmia suggests that these figures would be considerably higher. A targeted approach to prevention based on detection of atrial electrical vulnerability is a reasonable strategy. The electrocardiogram has become a valuable tool for this purpose.
A careful observation of the electrocardiogram allows to realize that the duration of the atrial depolarization manifested as a P wave is not the same in the different recording leads, the phenomenon occurs in both healthy and sick people (with cardiovascular or other pathologies). Based on this fact, in the late nineties Dilaveris et al. proposed that the interleads differences in terms of P wave duration could be expressed through a parameter they called P wave dispersion (PWD), which could predict paroxysmal AF in the absence of comorbidities.3
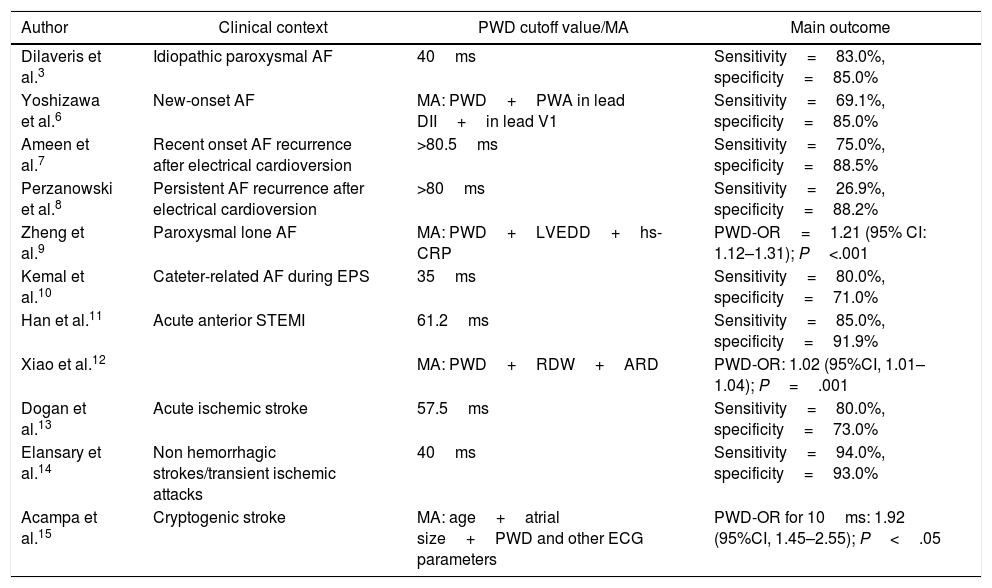
Clinical utility in the context of AFMultiple investigations demonstrate the utility of PWD in predicting AF (Table 1).3-15 In the pioneering study by Dilaveris et al. a cutoff value of 40ms for PWD separated patients with paroxysmal AF with a sensitivity of 83% and specificity of 85%.3 Yoshizawa et al. in a case-control study showed that PWD was an independent predictor of new-onset AF with values that significantly exceeded those observed in controls (59.6±14.8ms vs. 33.5±12.9ms; P=.001).6 One study found that PWD correctly discriminated AF recurrences in new-onset AF patients undergoing electrical cardioversion, starting at a cutoff point >80.5ms,7 a finding very similar to that found in another investigation.8 Chang et al. found increased PWD values in patients with lone paroxysmal AF compared to controls. 16
Main studies demonstrating the predictive value of P wave dispersion for the occurrence of atrial fibrillation.
| Author | Clinical context | PWD cutoff value/MA | Main outcome |
|---|---|---|---|
| Dilaveris et al.3 | Idiopathic paroxysmal AF | 40ms | Sensitivity=83.0%, specificity=85.0% |
| Yoshizawa et al.6 | New-onset AF | MA: PWD+PWA in lead DII+in lead V1 | Sensitivity=69.1%, specificity=85.0% |
| Ameen et al.7 | Recent onset AF recurrence after electrical cardioversion | >80.5ms | Sensitivity=75.0%, specificity=88.5% |
| Perzanowski et al.8 | Persistent AF recurrence after electrical cardioversion | >80ms | Sensitivity=26.9%, specificity=88.2% |
| Zheng et al.9 | Paroxysmal lone AF | MA: PWD+LVEDD+hs-CRP | PWD-OR=1.21 (95% CI: 1.12–1.31); P<.001 |
| Kemal et al.10 | Cateter-related AF during EPS | 35ms | Sensitivity=80.0%, specificity=71.0% |
| Han et al.11 | Acute anterior STEMI | 61.2ms | Sensitivity=85.0%, specificity=91.9% |
| Xiao et al.12 | MA: PWD+RDW+ARD | PWD-OR: 1.02 (95%CI, 1.01–1.04); P=.001 | |
| Dogan et al.13 | Acute ischemic stroke | 57.5ms | Sensitivity=80.0%, specificity=73.0% |
| Elansary et al.14 | Non hemorrhagic strokes/transient ischemic attacks | 40ms | Sensitivity=94.0%, specificity=93.0% |
| Acampa et al.15 | Cryptogenic stroke | MA: age+atrial size+PWD and other ECG parameters | PWD-OR for 10ms: 1.92 (95%CI, 1.45–2.55); P<.05 |
95%CI, 95% confidence interval; AF, atrial fibrillation; ARD, aortic root diameter; ECG, electrocardiogram; EPS, electrophysiological study; hs-CRP, high-sensitive C-reactive protein; LVEDD, left ventricular end diastolic diameter; MA, multivariate analysis; OR: odds ratio; PWA, P wave amplitude; PWD, P-wave dispersion; RDW: red cell distribution width; STEMI, ST-segment elevation myocardial infarction.
Studying the role of inflammation in patients with paroxysmal AF, increases in ultrasensitive C-reactive protein have been found together with increased PWD values, demonstrating that both variables function as independent predictors of the aforesaid arrhythmia.9
Kemal et al. analyzed several parameters of the P wave in 145 patients undergoing electrophysiological studies with normal results and who were divided into 2 groups according to the occurrence or not of AF induced by catheters. The PWD was significantly higher in the group where AF occurred; in the logistic regression analysis this parameter was an independent predictor of AF, a cutoff value of 35ms determined catheter-induced AF with 80% sensitivity and 71% specificity.10 After AF ablation in 126 consecutive patients, Fujimoto et al. observed a significant decrease in PWD at the third and sixth month of proceeding together with the reduction in left atrial diameter and volume, so the authors concluded that PWD could be useful for the evaluation of reverse remodeling after catheter ablation of the AF.17 Walters et al. analyzed the effects on left atrial remodeling prospectively experienced by 38 patients with paroxysmal AF managed medically (group 1) and 20 undergoing AF ablation (group 2). In group 1, deterioration in total left atrial strain and an increase in PWD were observed, while in group 2 there was an improvement in total left atrial strain and reduction in PWD.18 In another study, the use of AF ablation by means of a hybrid technique (catheter and surgical ablation) significantly reduced PWD compared to other techniques.19
PWD in the context of various clinical situationsPWD can help discriminate patients with different types of diseases prone to developing AF in their lifetime.20 Several examples are presented below.
Cardiovascular risk factorsSystemic hypertensionIn a cohort of the REDISCOVER study consisting of 125 hypertensive patients, PWD was shown to be increased compared to a similar number of healthy controls.21 Furthermore, significantly higher PWD values were observed in male hypertensive patients of recent clinical onset compared to controls matched for age, height, weight, and body mass index, as well as a positive linear correlation with the systolic and diastolic blood pressure,22 and with the degree of diastolic blood pressure response produced by the sustained weight test,23 although in this case the relationship was established with the maximum corrected duration of the P wave. In another series of hypertensive patients, PWD was correlated with mean arterial pressure.24
In normotensive, prehypertensive and hypertensive children, Chávez et al. found higher PWD values in the last 2 groups and a significant correlation between the left atrial area and PWD that was more intense when only the group of hypertensive patients was analyzed.25 In another study using the same pediatric population, these authors reported a significant correlation of PWD with systolic blood pressure and, after carrying out a multivariable analysis that included several echocardiographic parameters, found that the peak A-wave velocity was the only independent variable significantly related to PWD.26
In women with hypertensive disorders of pregnancy, higher PWD values have been reported compared to controls, with positive and significant correlations with systolic (r=0.409; P<.001) and diastolic pressure (r=0.390; P<.001).27
ObesitySert et al. studying obese adolescents showed that PWD was increased compared to a control group, in a multiple linear regression analysis that the authors carried out, insulin resistance turned out to be an independent predictor of PWD.28 Weight loss after bariatric surgery was significantly correlated with a decrease in PWD after evaluating its evolution at the start, and after 3-months, 6-months and 1-year in 122 patients undergoing this operation, which allowed Yilmaz et al. to consider that these results indirectly suggest a reduction in the risk of AF occurrence in this setting.29 A similar result was found in obese patients after a 5% reduction in body weight carried out with diet, in these patients there was a significant decrease of the PWD compared to cases that did not reach this goal.30
Cardiovascular pathologyHeart failureAbdellah et al. studied several clinical characteristics in 110 patients with heart failure in sinus rhythm with (>40ms) and without PWD (≤40ms).31 The authors found that those patients with PWD had the following characteristics: 84% in New York Heart Association class III or IV, 74% with left ventricular ejection fraction <35%, 78.7% had paroxysmal AF and 89.4% could not complete >200m in the 6-minute walk test, in addition patients with PWD had more hospitalizations (72% vs. 28.6%; P<.02) and higher 1-year mortality rate (20% vs. 8.6%; P<.04) than patients without PWD.
Pulmonary hypertensionAfter studying 33 patients with pulmonary hypertension, Cimen et al. found that in the multiple linear regression analysis PWD was independently related to the functional capacity evaluated by the 6-minute walk test, suggesting that it could constitute an indirect estimate of the functional status of these patients.32
Myocardial infarctionIn the context of acute ST-segment elevation myocardial infarction, Castro et al. reported significantly higher PWD values in complicated cases with AF compared to those who did not develop such an electrical disorder.33 In 144 patients with primary anterior ST-segment elevation myocardial infarction, it was found that PWD was increased in those who developed paroxysmal AF (68.5±11, 9 vs. 48.7±9.6; P<.001), being a significant predictor of paroxysmal AF in the univariate analysis.11
Syndrome XYilmaz et al. found that PWD was higher in patients with syndrome X compared to healthy controls matched by sex, age, and hemochemical parameters.34
Pathology and/or non-cardiovascular conditionsLow birth weightIn adult subjects with extremely low birth weight, PWD was found to be significantly increased compared to controls (44.4±3.5 vs. 37.1±1.1ms; P=.0001).35
Neurocardiogenic syncopePWD could be an indirect marker of the autonomic alterations seen in patients with neurocardiogenic syncope. Lee et al. studied 54 adolescents with this type of syncope and they observed that PWD exhibited higher values compared to a control group (69.7±19.6 vs. 45.5±17.1ms; P<.001) supporting the previous statement.36
Chronic kidney diseaseStudying 439 patients with stage 3–5 chronic kidney disease, Huang et al. observed that the PWD reached an average value of 88.8±21.7ms, when performing a Cox regression analysis this parameter was associated with the occurrence of death and a faster decline in renal function.37 In patients undergoing hemodiafiltration and hemodialysis, it was found that PWD did not change after the first procedure while it increased with the second, which could be the result of a more balanced reduction of intracardiac and intravascular volume, a greater balance of serum sodium concentrations and the powerful antioxidant/anti-inflammatory effect of hemodiafiltration.38
Hematological diseasesThe increased risk for the occurrence of AF in patients with β-thalassemia major was exposed in a case-control study in which increased PWD values were observed (60.5±11.0ms vs. 48.6±7, 8ms; P<.001).39 In patients with atrial tachycardia classified in ascending order according to the red cell distribution width, it was found that the latter was positively correlated with PWD (r=0.148; P<.002) and that both variables were independent predictors of the occurrence of atrial tachycardia in the logistic regression analysis.12
Neurological disordersAn investigation that analyzed the role of inflammation in the occurrence of AF after a cryptogenic stroke found a significant correlation between PWD and C-reactive protein (r=0.28) and that PWD acted as a significant mediator of the relationship between C-reactive protein – AF occurrence, accounting for 40% of the association.40 As AF plays an important role in some cases of cryptogenic stroke, its investigation by means of prolonged electrocardiographic monitoring techniques is usually indicated, but this is expensive and in many places it is not yet available that is the reason why Acampa et al. have suggested the use of PWD in order to select better candidates for these tests.41 These same authors in another study demonstrated that PWD was a predictor of AF in cases with cryptogenic stroke (odds ratio, 1.92; 95% confidence interval, 1.45–2.55).15 In patients with acute ischemic stroke, PWD proved to be useful as a predictor of paroxysmal AF using a cutoff value of 57.5ms with a sensitivity of 80% and specificity of 73%, and it was also in the study conducted by Elanzary et al.13,14
Another neurological disease in which increased PWD values have been seen is myotonic dystrophy type 1, and these values are even higher in cases of this disease with paroxysmal AF.42 A meta-analysis that included 3 studies in migraine patients found that PWD showed significantly higher values compared to controls (mean difference, 3.62ms; P=.006).43
Obstructive sleep apneaRecently, a case-control study conducted in children with obstructive sleep apnea found increased PWD values in the most severe cases and proposed a cutoff value of 26.5ms (area under receive operating characteristic curve, 0.839; sensitivity, 89.6ms; specificity, 61.4%) for the detection of children with this disease.44
OphthalmologyA significant increase in PWD compared to controls has also been observed in patients with central chorioretinopathy.45
Psychological and psychiatric disordersA small study conducted in patients with obsessive-compulsive disorders found that PWD was significantly increased compared to a control group with normal mental status.46 Uyarel et al. studying healthy young people who were evaluated using the STAI score (Spielberger State-Trait Anxiety Inventory) found that the state anxiety subscale (STAI-1) and the trait anxiety subscale (STAI-2) were independent predictors of PWD with a greater contribution from STAI-1 (65 and 35%), which demonstrates the relationship between PWD and anxiety.47
Sexual disordersIn men with erectile dysfunction, PWD showed significantly higher values (48.1±5.9ms vs. 38.0±3.9ms; P<.05) and was inversely related to the severity of the disease (r=−0.662; P<.05).48
AnesthesiologyThe use of balanced sedation with propofol (midazolam+propofol) could entail some risk of AF, as observed in a group of patients who underwent superior endoscopy after which an increase in PWD was observed, in another group where sedation was not used, this effect was not seen.49.
MiscellaneaSportIn young athletes of high performance practicing marathon, long distance running and weight lifting, Carmona et al. demonstrated an increase in PWD at the expense of minimum P duration and were the first to report a positive and significant correlation between PWD and training duration,50 a finding that was also observed in soccer players.51
AviationIn military jet pilots Çakar et al. found increased PWD values and suggested that this parameter should be included in routine check-ups as an indicator of AF risk.52
PWD has also been studied in other clinical settings such as: valvular heart disease, cardiac surgery, after cryoablation of AF, cardiac resynchronization therapy, after percutaneous closure of the left atrial appendage, as a predictor of postoperative AF, in patients with myxoma, hypertrophic cardiomyopathy, Brugada syndrome, chronic obstructive pulmonary disease, diabetes mellitus, diabetes insipidus, thyroid disorders, as well as in the presence of rheumatic, digestive and gyneco-obstetric problems.53,54
Reference valuesDifferent normal values of PWD have been published, observing a wide variability among them. Analyzing 295 patients randomly selected from the original cohort of the Framingham study with a wide age range and without cardiovascular disease or hypertension, diabetes mellitus or obesity, Magnani et al. determined that the median of the PWD was 34ms with a range from the 25–75 percentile of 28–43ms.55 Pérez Riera et al. consider that the normal value is between 20–38ms with an average of 29ms,53 almost equal to that reported in the control group used by Dilaveris et al. that presented a range of 21–35ms (mean, 28ms).3 A large study that included 1353 healthy young men on service in the Greek Air Force observed an average PWD value equal to 38.4ms with a range between 13–80ms.56 In 150 controls with no history of paroxysmal AF, Chang et al. observed that the PWD presented a median of 46.0ms with an interquartile range of 38.5–57.7ms.16
Recently O’Neill et al. reported reference values for PWD in Southeast Asian women and men (women, 22±12ms; men, 25±12ms) and in Caucasians (women, 24±12ms; men, 28±12ms).57 Carmona et al. in their control group observed that the mean value of PWD was 25ms with a standard deviation of 8.61ms,22 very similar to that observed by Scavenius et al. who obtained a value of 27±13ms.58 In 143 healthy volunteers with an average age of 59.17±10.87 years who presented an ergometric test and normal coronary tomography, the PWD was 34.8±12.54ms.34 In 125 healthy controls belonging to a cohort of the REDISCOVER study and with an average age of 51.3±13.6 years, it was observed that the PWD had a mean value of 54.63±21.9ms.21
After analyzing a Cuban pediatric population, Chávez et al. determined that the 95th percentile of the PWD was at 50ms, a value that was similar in both sexes.59 In 232 children between the ages of 7 and 15, Köse et al. found no differences between the sexes for PWD (female 26.8±6.2ms vs. male 27.2±5.3ms; P=.643).60
Measurement methodsPWD is determined by subtracting the minimum P wave duration from the maximum P wave duration, taking into account the 12 leads of the electrocardiogram (Fig. 1). Its measurement has not yet been standardized,53 but different methods for obtaining it are recognized, all well accepted, although the different authors highlight some methods over others. PWD have been calculated by measurements on paper or digitized Images61 (with optical scanner or digital records presented by special software) using hand-held calipers, but there are also automated measures. The onset of the P wave is defined as the point of first detectable upward or downward slope from the isoelectric line for positive or negative waveforms, respectively. The return of P wave deflection to baseline is considered the P wave offset.

Panels A and B show identical electrocardiographic traces taken from a healthy patient to exemplify the PWD measurement technique using a 12-lead simultaneous recording and hand-held caliper. Pmax and Pmin were measured in the same beat to avoid the phenomenon of P wave lability over time. The measurements were made with a sweep speed of 50mm/s and amplification of 20mm/mV. Pmax, maximum P wave duration; Pmin, minimum P duration; PWD, P wave dispersion.
Digital measurements stand out above manual made on paper with a reduction of the relative intraobserver error from 24% to 13% and of the interobserver error from 30% to 14%61 with very similar results reported by others.62 Evaluating a cohort of the Framingham, Magnani et al. determined that the intraclass intraobserver and interobserver coefficient for the measurement of PWD was 0.82 and 0.70, respectively, concluding that it was excellent for the first and good for the second.63 Dilaveris et al. consider that the simultaneous recording of 12 leads is mandatory to avoid the phenomenon of P wave lability over time.64 Taking the measurement with a paper velocity of 50mm/s and an amplitude of 20mm/mV has become the trend for many researchers, but additionally magnifications can be performed. Some studies have used a minimum of 8 to 9 leads as an inclusion criterion for calculating the PWD.61
Possible etiology of the electrocardiographic phenomenon of PWDAlthough this parameter has been available for more than 20 years for clinical use, the factors that give rise to it have not yet been fully defined. Two main theories have been proposed to explain the origin of PWD. The first of these is based on the inhomogeneous atrial propagation of the electrical impulse, which would lead to temporal discrepancies in the stimulus conduction between the different areas of the atria, that is, areas with slower or faster conduction.3,20,41,53 The theory of inhomogeneous conduction (local theory) maintains that the leads of the electrocardiogram, when arranged in such a way that they capture the electrical activity of the heart from 12 different sites, might be able to record P waves of different durations depending on the atrial area explored. Those regions of the atria with slower conduction zones would be responsible for longer duration P waves while the opposite would happen if the zone explored by a given lead presented faster conduction, these duration differences would give rise to the PWD phenomenon.
Using 2-dimensional strain rate in patients with idiopathic dilated cardiomyopathy, Badran et al. found that PWD is directly correlated in these patients (r=0.45; P<.00001) with the quantification of the electromechanical delay of the left atrium, but this result was not found in the control group.65 In addition, higher PWD values have been found and right and left interatrial and intra-atrial electromechanical delays measured by 2-dimensional strain rate in non-dipper hypertensive patients compared to dipper.66 Demir et al. observed that in patients with type 2 diabetes mellitus PWD was directly and significantly correlated (r=0.428; P<.001) with the intraleft atrial electromechanical delay interval estimated by tissue Doppler.67 In hypertensive patients without a history of AF the PWD was an independent predictor of intra left atrial conduction times (B=0.306; P=.04) and interatrial conduction times (B=0.483; P=.05) measured by tissue Doppler, in addition there was a positive correlations between interatrial (P=.722), intra right (P=.643) and intra left (P=.722) atrial conduction times and PWD.68 Ermis et al. also found that PWD was significantly correlated with intra and interatrial conduction times in prehypertensive patients, using the same measurement method.69
The second theory (global, projection or vectorial theory) has hardly been mentioned. It is based on the basic principles of vectorial electrocardiography, which consists in projecting the atrial depolarization vector (of X spatial direction) on the axis system that has the leads of the frontal and horizontal plane according to standardized configurations.70 Applying basic principles of representation of coordinates in 2-dimensional planes we have that, without neglecting the magnitude of a vector, the more parallel its direction is with respect to a coordinate axis, its projection will be completely or almost complete on it, which for an electrocardiographic leads would be a P wave of maximum or almost maximum voltage and inscribed throughout its duration without parts of that wave manifesting.
At the other extreme, if a given vector of atrial depolarization followed a direction perpendicular to any coordinate axis, its projection on it would be impossible, and the equivalent in electrocardiography is the lack of inscription of the vector in the lead that represents the coordinate axis.71 We must emphasize that, although in practice it is recommended to determine the average vector, there are actually multiple instantaneous vectors72 that are manifested as the atrial depolarization proceeds. In this way each of the vectors that are generated (instantaneous vectors) can have different directions in time (± parallel or ± perpendicular) and therefore different projection relationships with the different leads of the electrocardiogram, since each of these vectors is common to all leads at any given time. An instantaneous vector would have a global effect on all leads. Because the P wave in any given lead is registering as the electrocardiograph can detect the multiple vectors that make it up, there will be P waves of greater or less duration if in certain leads there are more or less perpendicular projections of a common vector during certain fractions of time. This tends to manifest mainly at the beginning and end of atrial depolarization, where the generated potentials have lower magnitudes and are more likely not to be reflected in the P wave inscription process. As a result, isoelectric or very low amplitude intervals would occur, only detectable at high magnifications.
The consequences of this phenomenon were highlighted by Zimmer et al., who measured the PWD in 94 patients with 2 different magnifications, the first at paper speed of 50mm/s and amplification×8, the second at 200mm/s and magnification×128–256.73 In the first case, a mean value of PWD equal to 45.1ms was obtained while at maximum amplification the mean was 1.2ms. However, to our knowledge, there is only this work demonstrating the effect of the hidden portions of the P wave as a plausible and alternative explanation of the PWD phenomenon.
ConclusionPWD has consistently been shown to predict the occurrence of AF. Its use has been extended to different clinical settings in which it would be desirable to detect vulnerable individuals to the development of AF in the future. PWD is considered by most researchers to be the result of inhomogeneous conduction of the atrial electrical impulse, but a vectorial explanation may play a role in its genesis. The large body of evidence surrounding PWD supports its use in clinical practice.
FundingThis research did not receive any specific grant from funding agencies in the public, commercial, or not-for-profict sectors.
Conflicts of interestAuthors declare no conflict of interest related to this article.