Publique en esta revista
Información de la revista
Vol. 60. Núm. 2.
Páginas 117-126 (abril - junio 2025)
Compartir
Compartir
Descargar PDF
Más opciones de artículo
Visitas
...
Vol. 60. Núm. 2.
Páginas 117-126 (abril - junio 2025)
Original article
Acceso a texto completo
Influence of COVID-19 on the prevalence of diabetes mellitus and use of health care services in Gran Canaria
Influencia de la COVID-19 en la prevalencia de la diabetes mellitus y la utilización de servicios sanitarios en Gran Canaria
Visitas
162
Roberto Sánchez Medinaa, Alejandro de Arriba Fernándezb,
Autor para correspondencia
alejandrodearribafdez@gmail.com

Corresponding author.
, Ángela Gutiérrez Pérezc, José Luis Alonso Bilbaoc
a Servicio de Medicina Preventiva, Complejo Hospitalario Universitario Insular Materno Infantil, Las Palmas de Gran Canaria, Spain
b Servicio de Medicina Preventiva, Gerencia de Servicios Sanitarios del Área de Salud de Fuerteventura, Puerto del Rosario, Fuerteventura, Spain
c Gerencia de Atención Primaria de Gran Canaria, Las Palmas de Gran Canaria, Spain
Este artículo ha recibido
Información del artículo
Resumen
Texto completo
Bibliografía
Descargar PDF
Estadísticas
Figuras (3)
Mostrar másMostrar menos
Tablas (2)
Table 1. Registration levels of different diabetes mellitus care related variables, according to income level in 2019 versus 2022.
Tablas
Table 2. Mean values of diabetes mellitus-care process variables according to income level, in 2019 versus 2022.
Tablas
Mostrar másMostrar menos
Abstract
Introduction and objectives

The prevalence of diabetes mellitus (DM) has increased faster in low- and middle-income countries. We determined how the COVID-19 pandemic may have affected the relationship between income level and prevalence of DM, disease management, and the use of primary care services.

Methods

Descriptive cross-sectional study. It included diabetic patients over 14 years of age residing in Las Palmas de Gran Canaria as of 31 December 2022. The results were compared with those of a pre-pandemic study in 2019.
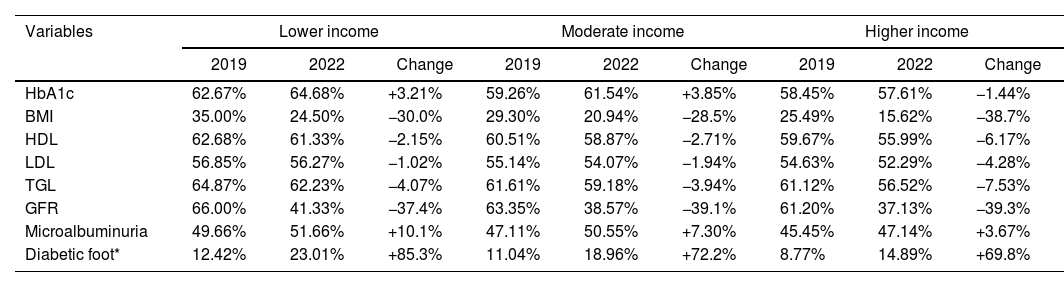
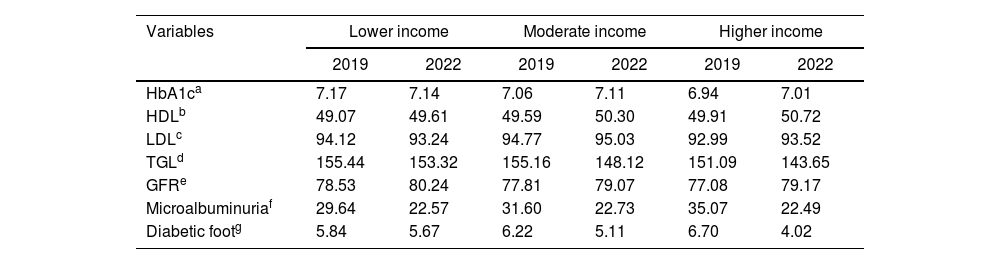
Results

The prevalence of DM in 2022 in Las Palmas de Gran Canaria was almost identical to that of 2019, with a slight decrease in the low- and high-income groups, and an increase in the middle-income group. The average age of the population with DM increased. The average number of visits to the doctor increased, while visits to the nursing home decreased. A worsening of glycosylated hemoglobin and low-density lipoproteins was found in high and middle incomes. The trend was the opposite for body weight, with a 1.2% increase in the prevalence of overweight/obesity in low incomes.

Conclusions

Lower incomes were associated with worse outcomes in terms of overweight and obesity. The situation of people with DM with overweight or obesity worsened compared to 2019 for the lower-income population.

Keywords:
Diabetes mellitus
Income level
Social determinants
Inequity
COVID-19
Resumen
Introducción y objetivos

La prevalencia de diabetes mellitus (DM) ha aumentado más rápido en los países de ingresos bajos y medios. Se determinó cómo la pandemia de COVID-19 pudo haber afectado a la relación entre nivel de ingresos y prevalencia de DM, el abordaje de la enfermedad y el uso de los servicios de atención primaria.

Métodos

Estudio descriptivo transversal. Incluyó a pacientes diabéticos mayores de 14 años residentes en Las Palmas de Gran Canaria a 31 de diciembre de 2022. Los resultados se compararon con los de un estudio previo a la pandemia de 2019.

Resultados

La prevalencia de DM en 2022 en Las Palmas de Gran Canaria fue casi idéntica a la de 2019, con un ligero descenso en los grupos de rentas bajas y altas, y un aumento en el grupo de rentas medias. La edad media de la población con DM aumentó. El número medio de visitas al médico aumentó, mientras que las visitas a enfermería disminuyeron. Se encontró un empeoramiento de la glucohemoglobina y las lipoproteínas de baja densidad en los ingresos altos y medios. La tendencia fue la opuesta para el peso corporal, con un aumento del 1,2% en la prevalencia de sobrepeso/obesidad en los ingresos bajos.

Conclusiones

Los ingresos más bajos se asociaron a peores resultados en materia de sobrepeso y obesidad. La situación de las personas con DM con sobrepeso u obesidad empeoró en comparación con 2019 para la población de menores ingresos.

Palabras clave:
Diabetes mellitus
Nivel de ingresos
Determinantes sociales
Inequidad
COVID-19
Texto completo
Introduction

Diabetes mellitus (DM) is a chronic disease characterized by several metabolic disorders, which are due to alterations in the secretion and action of insulin.1 There are two types of diabetes: type 1, mainly (though not exclusively) diagnosed in childhood, is due to autoimmune destruction of pancreatic beta-cells; type 2, mainly occurring in adults with cardiovascular risk factors (sedentarism, unhealthy lifestyle, advanced age, overweight/obesity), is due to a progressive deficit in insulin secretion and accounts for more than 90% of all DM cases.2–5

Chronic non-transmissible diseases, like DM, remain one of the leading causes of mortality worldwide. From 1980 to present, DM global prevalence has tripled. Although factors like population growth and aging underly such figures, sedentary lifestyle and overweight/obesity are considered major causes.2

The International Diabetes Federation (IDF) estimated that 700 million people worldwide will suffer from diabetes by 2045.2,5,6 In the European Union, DM prevalence shows an increasing trend, from 16.8 million diabetic people in 2000 to 32.3 million in 2019. As per sex, DM cases in men raised from 7.3 to 16.7 million, while in women, they went from 9.5 to 15.6 million in that period.1,7

In Spain, DM prevalence raised from 4.09% in 1993 to 7.51% in 2020, with a peak of 7.8% in 2017. Currently, the highest prevalence rates are found in the oldest age groups, with 23.25% of diabetic patients older than 75 years, followed by 18.63% patients in the 65–74 age group and 10.09% in the 55–64 age group. Although DM used to be more prevalent in women, this trend was inverted in 2020 (7.11% women versus 8.52% men).1,7

Within Spain, there are significant differences, with higher prevalence in southern regions (Andalusia, Murcia, Valencia, Canary Islands). Among them, the Canarian region shows the highest prevalence in Spain, namely 3.19 points above the national average.3,4 Moreover, the Canarian rate of overweight/obesity (one of the major modifiable DM-associated factors) is also above the national mean; e.g. the combined prevalence of DM plus obesity in the Grand Canary Island is in the range of 25–20%.1,7

The concept of health integrates several determinant factors besides those particularly belonging to an individual like genetics, biology, risk behaviors and lifestyle; it also includes social and economic factors.8 The World Health Organization (WHO) defines social determinants as the circumstances in which individuals are born, grow up, live, work and age, including the health system. Such circumstances are the result of the distribution of wealth, power and resources at global, national and local levels, which in turn depends on local policies.9 The economic level is among the social factors influencing regional differences in the prevalence of DM and its consequences. In Spain, the economic level is inversely associated with DM-prevalence, with southern regions showing the lowest incomes together with the highest prevalences. The mean annual personal income in the Canary Islands was € 9487 in 2019, namely € 2193 less than the national average. In addition, 32.1% of the Canarian population was at risk of poverty, compared to 21.5% in the whole country.7

The relationship between DM prevalence and economic status has varied over time. At the end of the 20th century, most diabetic patients belonged to economically privileged groups. Through the years, the pattern reversed, and nowadays, the prevalence grows much faster in lower- and middle-income countries and in marginal areas of developed countries.10,11

In the city of Las Palmas de Gran Canaria (LPGC), the DM prevalence 2019 was 11.41%, higher than the average of the Grand Canary island (10.89%) and of Spain (7.8% >18 years).12 Furthermore, the city presents large economic differences between different districts (classified by postcode); e. g. Ciudad Jardín (PC 35005) shows the highest mean gross income (€ 53893) while La Paterna (PC 35013) had € 19291, in 2020, according to data from the State Tax Administration Agency (AEAT) website. Notice that the overall mean of the municipality was € 28268.13

There is a large body of evidence that supports the relationship between socioeconomic level and lifestyle, diet, health care and control of the disease in diabetic people. Financial inequality not only impacts life expectancy, but also makes DM onset up to two times more likely.6,7,10,11,14

A study on DM and income level in LPGC was published in 2019.12 It was therefore interesting to evaluate possible changes in prevalence, as well as the potential impact of the COVID-19 pandemic on DM care and metabolic control. With the emergence of SARS-CoV-2 by the end of 2019 and the classification of COVID-19 as a pandemic at the beginning of 2020, the follow-up of chronic patients became more complicated and deficient. Measures adopted in many countries, including Spain, to control the spread of the virus, involved lifestyle changes that greatly impacted the population. Restrictions to mobility, social distance and home confinement impacted daily routines and especially affected most vulnerable groups.15–17 Many scientific organizations, like the WHO or the Spanish Academy of Nutrition and Dietetics have recognized the essential role of diet and physical activity in the prevention and treatment of non-transmissible diseases.18,19 In this regard, such organizations released diet and exercise recommendations for the confinement period with the aim of minimizing potential decompensations in such patients.20 In addition, during higher incidence periods, vulnerable patients, including those with DM, were advised to avoid hospitals or health centers as much as possible.21 Furthermore, the fact that authorities considered them higher-risk for COVID-19 and the consequences of such consideration, contributed to increase their stress and anxiety.22 It may be postulated that such patients may have seen their baseline situation adversely affected in recent years, thus requiring more visits to the doctor's or the nurse's, or even more hospitalizations, with consequent load on the health system and themselves, in times of overloaded health care services. Furthermore, DM-diagnosed patients, who acquired SARS-CoV-2 infection, may have developed poorer post-covid metabolic control as evidenced in some studies.23

Methods

This was a cross-sectional descriptive study.

Study populationInclusion criteria

Patients older than 14 years, diagnosed with DM of any type and living in LPGC.

A confirmed case of diabetes was considered for patients presenting positive results on two of the following tests, on different days:5

  • glycosylated hemoglobin (HbA1c) ≥6.5%.

  • fasting plasma glucose ≥126mg/dL

  • oral glucose tolerance test ≥200mg/dL at 2h

  • random plasma glucose test ≥200mg/dL

Exclusion criteria

Patients diagnosed with middle hyperglycemia or pre-diabetes – namely those with altered basal glucose (fasting plasma glucose=110–125mg/dL), glucose intolerance (oral glucose tolerance test=140–200mg/dL) or HbA1c in the range 5.7–6.5% were not included.

Study period

The period of the study was from 1 January to 31 December 2022. All data from living patients as per 31 December 2022 were included. Data on the use of primary care services corresponded to the whole year 2022. Data on the registration of metabolic control markers and intermediate outcomes, as well as their values, also corresponded to the whole of 2022, except for patients with missing data, for whom the latest measurement was used regardless of the date. This study has been compared with a study of similar conditions carried out between 1 January 2019 and 31 December 2019.

ObjectivesMain objective

To determine possible consequences of the COVID-19 pandemic on the relationship between DM-prevalence and income level in the city of Las Palmas de Gran Canaria.

Secondary objectives

  • (a)

    To compare the sociodemographic characteristics of the LPGC population suffering DM in 2019 versus 2022.

  • (b)

    To compare the use of primary care services by the LPGC population suffering DM in 2019 versus 2022.

  • (c)

    To compare the level of registration of metabolic control variables by the LPGC population suffering DM in 2019 versus 2022.

  • (d)

    To compare main process markers and intermediate outcomes of metabolic control in DM patients in 2019 versus 2022.

VariablesDemographic variables

  • -

    Age: quantitative variable categorized in age groups according to the threshold set in the “Programa de Gestión Convenida 2020”,24 which establishes the main objectives based on the III Health Plan of the Canary Islands (Plan de Salud de Canarias).

  • -

    Sex (man/woman).

  • -

    Home postcode (35001-35019).

Variables of use of primary care services (health center, home, telephonic, virtual, emergency department or incidences)

  • -

    Number of visits to the doctor's office in 2022, classified into: 1–4 visits, 5–8 visits, and more than 8 visits.

  • -

    Number of visits to the nurse's office in 2022, classified into: 1–4 visits, 5–8 visits, and more than 8 visits.

Variables of metabolic control and healthcare process

  • -

    Latest recorded values of HbA1c.

  • -

    Latest recorded values of high-density lipoprotein cholesterol.

  • -

    Latest recorded values of low-density lipoprotein (LDL) cholesterol.

  • -

    Latest recorded values of triglycerides.

  • -

    Latest recorded values of glomerular filtrate (estimated with the MDRD-4 IDMS formula).

  • -

    Latest recorded values of albumin/creatinine ratio.

  • -

    Latest recorded values of body mass index (BMI).

  • -

    Date of diagnosis of diabetic foot and feet examination; classified as low-, moderate- or high-risk, according to the Canarian guidelines for management of diabetic foot (Guía de actuación. Pie diabético en Canarias).25

  • -

    Date of diagnosis of diabetic retinopathy and examination in primary care; classified into “normal outcome” or “abnormal/inconclusive outcome”.

Furthermore, the date of registration of any of the healthcare process variables was taken into account.

Economic variables

  • -

    Mean annual personal gross income in 2020, according to postcode; classified into three levels: lower-income (≤€ 22292), middle-income (€ 22292–35666) and higher-income (≥€ 35666).

This classification was based on the data from the Organisation for Economic Co-operation and Development (OECD), which establishes groups according to the median value. The Canarian median was €17833.25 The OECD considers lower incomes those below 75% of the median, middle incomes those between 75% and 200% of the median and higher incomes, those over 200% of the median. Middle incomes are further split into lower-middle income (75–125% of the median) and higher-middle income (125–200% of the median).26,27 In this study, lower-incomes (<75%) and lower-middle incomes (75–125%) were clustered, thus middle incomes were considered those in the range of 125–200% of the median.

Data source

  • -

    The Canary Islands Health Service Electronic Primary Care Medical Record database (DRAGO-AP) was used to collect data on the clinical records and use of primary care services of people assigned to the public health service.

  • -

    The LPGC statistics of the Personal Income Tax-payers in the largest municipalities record published on the website of the AEAT, were used to obtain information on intra-municipal gross and disposable income corresponding to 2020.13

  • -

    Data from a 2019 study on DM and income level in LPGC were used for comparison.12

  • -

    Statistics from the National Institute of Statistics (INE) were used to determine the number of LPGC inhabitants, total and stratified by sex, in order to calculate DM prevalence, total and by sex.

Data analysis

For the descriptive analysis, categorical variables were expressed as frequencies and percentages, while quantitative ones were expressed as measures of centralization (mean and median) and dispersion (standard deviation). For bivariate analysis, the chi-square test was used for qualitative variables and the Student t test for quantitative ones. Statistical significance was considered for P<.05, which corresponded to 95% confidence interval. Statistical analysis was performed with the IBM Statistical Package for the Social Sciences (SPSS) v21, and Microsoft Excel (2010).

Ethical aspects

The project was submitted to the provincial CEI (Research Ethics Committee) of the Hospital de Gran Canaria Dr. Negrín (HUGCDN) for approval: 2022-558-1. It was also approved by the Research Unit of the Primary Care Management of Gran Canaria. Since this study used clinical-epidemiological data of the patients, extracted from the DRAGO-AP clinical histories in an anonymous manner and the information of the patients on the average gross income by postcode is published on the AEAT website and due to its observational nature, which meant that it did not imply any risk for the participants, nor changes in the treatment or diagnostic procedures, outside of normal clinical practice, an informed consent signed by the patient was not necessary. The study was carried out in accordance with the requirements of the Declaration of Helsinki.

Results

DM prevalence in people aged ≥14 years, in LPGC, in 2022 was almost identical to that of 2019 (11.41% in 2019 versus 11.39% in 2022). However, noticeable differences were found in the distribution according to personal income: lower-income groups changed from 58.77% in 2019 to 40.49% in 2022 (31% decrease), middle-income ones considerably increased from 26.78% to 47.78%, and higher-income groups decreased by 18%, from 14.34% to 11.73%.

Regarding the distribution per sex, DM prevalence remained almost the same, with a slight increase in women (from 51.44% in 2019 to 51.57% in 2022). The mean age was also higher in 2022 in both sexes (from 65.82 to 66.36 years in men; from 67.21 to 67.71 in women). Actually, the number of people ≤70 years was 3% lower, and that of >70 years was 4% higher, thus evidencing an age increase in the DM population from 2019 to 2022.

In this period, the mean number of visits to the doctor's raised from 8.60 to 9.04 visits per patient (5.12% increase), although visits to the nurse's decreased from 5.84 to 5.65 (3.25% reduction). The same pattern of increasing visits to the doctor's and decreased visits to the nurse's was observed in all the three income levels (Fig. 1).

Fig. 1.

Mean number of visits to the doctor's and nurse's office per income level in 2019 versus 2022.

(0.35MB).

The registration of metabolic markers showed a particular pattern (Table 1). The registration of glycated hemoglobin increased, except in higher-income groups. Similarly, the registration of microalbuminuria increased a considerable 10% in lower-income groups versus almost 4% in higher-income ones. However, the registration of the lipid profile decreased in all income levels, as well as that of glomerular filtrate, which dropped between 37 and 39%, and BMI, which decreased between 28 and 39%. In general, increasing registration levels grew more in the lower-income group and decreasing ones dropped more markedly in the high-income one (Table 2).

Table 1.

Registration levels of different diabetes mellitus care related variables, according to income level in 2019 versus 2022.

Variables  Lower incomeModerate incomeHigher income
  2019  2022  Change  2019  2022  Change  2019  2022  Change 
HbA1c  62.67%  64.68%  +3.21%  59.26%  61.54%  +3.85%  58.45%  57.61%  −1.44% 
BMI  35.00%  24.50%  −30.0%  29.30%  20.94%  −28.5%  25.49%  15.62%  −38.7% 
HDL  62.68%  61.33%  −2.15%  60.51%  58.87%  −2.71%  59.67%  55.99%  −6.17% 
LDL  56.85%  56.27%  −1.02%  55.14%  54.07%  −1.94%  54.63%  52.29%  −4.28% 
TGL  64.87%  62.23%  −4.07%  61.61%  59.18%  −3.94%  61.12%  56.52%  −7.53% 
GFR  66.00%  41.33%  −37.4%  63.35%  38.57%  −39.1%  61.20%  37.13%  −39.3% 
Microalbuminuria  49.66%  51.66%  +10.1%  47.11%  50.55%  +7.30%  45.45%  47.14%  +3.67% 
Diabetic foot*  12.42%  23.01%  +85.3%  11.04%  18.96%  +72.2%  8.77%  14.89%  +69.8% 

GFR: glomerular filtration rate; HbA1c: glycosylated hemoglobin; HDL: high-density lipoprotein; BMI: body mass index; LDL: low-density lipoproteins; TGL: triglycerides.

*

No retinopathy data were recorded in the earlier (2019) study.

Table 2.

Mean values of diabetes mellitus-care process variables according to income level, in 2019 versus 2022.

Variables  Lower incomeModerate incomeHigher income
  2019  2022  2019  2022  2019  2022 
HbA1ca  7.17  7.14  7.06  7.11  6.94  7.01 
HDLb  49.07  49.61  49.59  50.30  49.91  50.72 
LDLc  94.12  93.24  94.77  95.03  92.99  93.52 
TGLd  155.44  153.32  155.16  148.12  151.09  143.65 
GFRe  78.53  80.24  77.81  79.07  77.08  79.17 
Microalbuminuriaf  29.64  22.57  31.60  22.73  35.07  22.49 
Diabetic footg  5.84  5.67  6.22  5.11  6.70  4.02 

GFR: glomerular filtration rate; HbA1c: glycosylated hemoglobin; HDL: high-density lipoprotein; BMI: body mass index; LDL: low-density lipoproteins; TGL: triglycerides.

a

Cutpoint 1–20.

b

Cutpoint 0–300.

c

Cutpoint 0–500.

d

Cutpoint 0–1200.

e

Cutpoint 0–200.

f

Cutpoint 0–500.

g

Non-quantitative variable; here expressed as percentage of high-risk or pathological/inconclusive, respectively.

Results showed a general improvement, though with striking worsening of HbA1c and LDL in higher and middle incomes; these were the only variables showing poorer results in 2022 than in 2019 (Fig. 2). However, the tendency was the opposite for body weight, with 1.2% increase in overweight/obesity prevalence in lower-income, 0.8% increase in middle-income and 1.5% reduction in higher-income (Fig. 3).

Fig. 2.

Percentage change of diabetes mellitus-care process variables according to income level, in 2019 versus 2022. GFR: glomerular filtration rate; HbA1c: glycosylated hemoglobin; HDL: high-density lipoprotein; LDL: low-density lipoproteins; TGL: triglycerides. Some variables, despite an increase in the graph, this represents an improvement in DM care such as HDL or GFR. On the other hand, in others, despite observing a decrease, this represents an improvement such as microalbuminuria or diabetic foot.

(0.31MB).
Fig. 3.

Classification of diabetes mellitus patients according to their latest BMI measure and income level in 2019 versus 2022. BMI: body mass index; DM: diabetes mellitus; LI: low income; MI: middle income; HI: high income.

(0.33MB).
Discussion

DM is an adequate disease to address health inequities, given its proven higher prevalence in socially disadvantaged groups in developed countries. It should be taken into account that our results may be strongly influenced by the fact that the Canary Islands have a lower average income than the country as a whole. In addition, the percentage of the population with higher education is also lower (27.9% versus 30.6%). Consequently, there is a higher proportion of people at risk of poverty (32.1% versus 21.5%).28

Making a decision on the median to be taken as a reference for the establishment of income levels was difficult because, on the one hand, the Canarian median income is rather lower than the national one (€ 17833 versus 21067) and, on the other hand, LPGC is an atypical “oasis” with a higher median income (€ 20933) than the regional (€ 17833) or provincial (€ 18154) median, and similar to the national one. However, the income level within the city of LPGC is highly variable, thus using the national median as a reference would have left only one higher-income district (per postcode) with the consequent reduction in statistical power. Therefore, we decided to use Canarian median to ensure representativity of the three income groups. In addition, lower- and lower-middle incomes were clustered because the stratification per postcode (instead of real income values) left us with no “only low-income” district regardless the median we used.26 Using the Canarian median income as a reference and clustering lower- and lower-middle incomes, representativity was granted for all levels, with 29% personal income tax payers in the lower-, 50% in the middle-, and 21% in the higher-income groups.26

In a different line of argumentation, differences due to the COVID-19 pandemic, in terms of observed changes per income level, might be due to methodological discrepancies in stratifying mean incomes per postcode in 2019 versus 2022.12

Similarly, the finding that the population had a higher mean age in this study than in 2019, may be evidencing two different outcomes: on the one hand, the DM population may be aging, in line with the well-known aging of the general population in Spain and in the Canary Islands; on the other hand, a reduction in regular healthcare activity, due to the efforts dedicated to the COVID pandemic, might have led to a reduction in the number of newly diagnosed DM cases. In a word, we might be encountering in 2022 the same subjects than in 2019, though 3 years older.

Regarding the control of the disease, as stated in an earlier Canarian study on type-1 DM patients, even if there is an increase in the incidence (although this was not verified in the present study), such an outcome would not be related to the COVID-19 pandemic. Actually, further studies reported an improvement in the control of the disease after the confinement, which, in line with this study.29 It is a fact that impact of the pandemic was not the same for all social groups. Thus, there are studies that have revealed that lower social classes were related to lower well-being and positive affect, with social class being a better predictor of well-being and general affectivity than educational level.30 In Spain, several studies have shown that the strict home confinement of 2020 had a greater impact on people from the most disadvantaged classes.31–33 Similarly, measures to reduce activity and mobility had a huge impact on the economic situation and the labor market, being greater for people with less qualified jobs.34 One study showed that the loss of income was greater the lower the income in the pre-pandemic period.35 Despite this, in the present study, some values DM care process such as HbA1c or LDL were worse in higher incomes in 2022 versus 2019. These minimal changes in average HbA1c values have important clinical and public health implications, since, although in individual terms it may be clinically irrelevant, in a population, it may be significant due to the large number of people affected. It is associated with an increased risk of cardiovascular and microvascular complications such as retinopathy, nephropathy and diabetic neuropathy. In addition, it could reflect deficiencies in health care systems or changes in adherence to treatment recommendations. All of this would entail higher costs for the health system due to an increase in the incidence of complications and hospitalizations related to diabetes.

Also, regarding the changes that the pandemic introduced in the public health system in terms of telematic care, the results show that inequalities in access to health care widened,36 although in the present study there is no data on the type of consultation (telephone or face-to-face consultation).

The results of comparing the underweight, normal-weight and overweight/obesity DM population in 2019 versus 2022, were in line with other studies that describe the influence of the COVID-19 pandemic on body weight. In a study conducted in the United Kingdom, 56% of participants reported consuming snacks more frequently and experiencing more difficulties with managing their weight (e.g., problems with motivation and food control) than before the lockdown, these trends being more pronounced among participants with higher BMIs. Studies conducted in Spain, reported weight gain in up to 36% obese people.37,38 Further studies in Spain support this trend, with BMI increase affecting all participants, although with greatest weight increase in the 21–35 years group (34%) and lowest one in the >65 group (6%).39 A further study described BMI increase in 44% participants during the lockdown.40 On the other hand, some authors reported more participants increasing BMI than decreasing it, although the later were considerably numerous, in the range of 21–31%41,42; and one study showed that that the population over 60 years of age had undergone considerable weight loss.43

Limitations

The limitations of this study were related to the fact that it is an ecological study. First, variable “personal income” could be affected by aggregation bias. Given that these data were extracted from the 2020 LPGC statistics of the Personal-Income-Tax-payers in the largest municipalities record, classified by postcode (using postcodes: 35001-35019), many people could have been assigned to an income level corresponding to their district, though different from their actual income. Such bias emerges from the AEAT classification system, which simply averages the income of taxpayers in a certain postcode, regardless of the possible dispersion within districts.

Second, this being an observational study, no causality can be established, but only an association between already known and newly observed factors, while the influence of other unknown or unperceived factors, that could potentially account for our results, cannot be ruled out; for example, lifestyle, management of baseline disease, DM type, number of years with the disease or concomitant acute/chronic conditions that may indirectly influence DM management, metabolic markers, or the use of primary care resources. Thus, inferences cannot be made about the causes of risk at the individual level.

Furthermore, when dealing with secondary information sources, the quality of data depends on the level of registration, which may pose handicaps to the statistical analysis of the study. For example, deficient registration by health providers in charge of completing electronic medical records, or derived from patients’ failure to attend scheduled appointments, patients using private health systems so that their appointments are not registered on our source database, etc. Finally, human error in metabolic marker quantification should be considered, as it was evident from the finding of strikingly incorrect values recorded, which led us to establish cutpoints to prevent us from including extreme unreasonable values in our analysis.

Conclusions

The total DM prevalence in LPGC in 2022 was almost identical to that of 2019. Lower- and higher-income groups showed a decrease, while the middle-income group showed an increase. The mean age of DM patients was higher than in 2019. The mean number of visits to the doctor's office increased, while visits to the nurse's decreased at all income levels. The level of registration of certain variables was better (microalbuminuria, diabetic foot and HbA1c, except in the higher-income group); while that of the rest of variables was poorer. The level of registration improved with decreasing income. Mean values of all variables improved, except those of HbA1c and LDL in the middle- and higher-income groups. The status of overweight/obese DM people became poorer than in 2019 for the lower-income population.

Funding

The authors declare that they have not received funding for the development of this study.

Ethical considerations

The project received approval from the provincial Research Ethics Committee (CEIm/CEIc) of the Hospital de Gran Canaria Dr. Negrín (2022-558-1) and the Research Unit of the Primary Care Management of Gran Canaria. Informed consent was not required. The study was carried out in accordance with the requirements of the Declaration of Helsinki and has taken into account the variables of sex and gender according to the SAGER guidelines.

The data are not publicly available due to ethical or privacy reasons. The data are available at the Gerencia de Atención Primaria de Gran Canaria, Las Palmas, Spain, for researchers who meet the criteria for access to confidential data.

All authors guarantee the accuracy, transparency and honesty of the data and information contained in the study; that no relevant information has been omitted; and that all discrepancies between authors have been adequately resolved and described.

Statement on the use of artificial intelligence

The authors declare that they have not used any type of generative artificial intelligence in the writing of this manuscript or for the creation of figures, graphs, tables or their corresponding captions or legends.

Authors’ contributions

All authors have participated in the conception of the design, collection of information and preparation of the manuscript, taking public responsibility for its content and approving its final version.

Conflicts of interest

The authors declare that they do not have conflicts of interest concerning this study.

References
[1]
La Diabetes en Spain y en el Mundo, en Datos y Gráficos. Madrid. Epdata.
(2021),
[2]
S.G. Di Santo, F. Franchini, B. Filiputti, A. Martone, S. Sannino.
The effects of COVID-19 and quarantine measures on the lifestyles and mental health of people over 60 at increased risk of dementia.
Front Psychiatry, 11 (2020), pp. 578628
[3]
International Diabetes Federation.
IDF Diabetes Atlas.
9th edition, (2019),
[4]
World Health Organization (WHO).
Diabetes.
(2021),
[5]
Federación Española de Diabetes FEDE.
Diabetes.
(2024),
[6]
C.J. Steele, B. Schöttker, A.H. Marshall, et al.
Education achievement and type 2 diabetes-what mediates the relationship in older adults? Data from the ESTHER study: a population-based cohort study.
BMJ Open, 7 (2017), pp. e013569
[7]
Dirección General de Programas Asistenciales.
Estrategia de Abordaje de la Diabetes Mellitus en Canarias. Las Palmas de Gran Canaria: Servicio Canario de la Salud.
(2021),
[8]
M. García Gámez.
El trabajo social en las dimensiones preventivas de las enfermedades crónicas-degenerativas con estudiantes de secundaria. Universidad Veracruzana. Facultad de Trabajo Social. Campus Poza Rica.
(2015),
[9]
Pan American Heath Organization (PAHO).
Social Determinants of Health.
(2009),
[10]
World Health Organization (WHO).
Global Report on Diabetes. Geneva.
(2016),
[11]
A.P. De Silva, S.H.P. De Silva, R. Haniffa, et al.
Inequalities in the prevalence of diabetes mellitus and its risk factors in Sri Lanka: a lower middle income country.
Int J Equity Health, 17 (2018), pp. 45
[12]
A.T. Gutiérrez Pérez.
Diabetes Mellitus y nivel de renta.
Diab Práct, 11 (2020), pp. 77-88
[13]
Estadística de los declarantes del IRPF de los mayores municipios por código postal. Renta bruta y Renta disponible inframunicipal.
Agencia Estatal de Administración Tributaria, (2020),
[14]
J.M. Millaruelo Trillo.
Diabetes y pobreza.
Diab Práct, 8 (2017), pp. 98-102
[15]
C. Eberle, S. Stichling.
Impact of COVID-19 lockdown on glycemic control in patients with type 1 and type 2 diabetes mellitus: a systematic review.
Diabetol Metab Syndr, 13 (2021), pp. 95
[16]
M.B. Ruiz-Roso, C. Knott-Torcal, D.C. Matilla-Escalante, et al.
COVID-19 lockdown and changes of the dietary pattern and physical activity habits in a cohort of patients with type 2 diabetes mellitus.
Nutrients, 12 (2020), pp. 2327
[17]
A. Verma, R. Rajput, S. Verma, V.K.B. Balania, B. Jangra.
Impact of lockdown in COVID 19 on glycemic control in patients with type 1 diabetes mellitus.
Diabetes Metab Syndr, 14 (2020), pp. 1213-1216
[18]
Academia Española de Nutrición y Dietética.
Recomendaciones de alimentación y nutrición para la población española ante la crisis sanitaria del COVID-19.
(2020),
[19]
R.M. Lana, F.C. Coelho, M.F.D.C. Gomes, et al.
The novel coronavirus (SARS-CoV-2) emergency and the role of timely and effective national health surveillance.
Cad Saude Publica, 36 (2020), pp. e00019620
[20]
G. Muscogiuri, L. Barrea, S. Savastano, A. Colao.
Nutritional recommendations for CoVID-19 quarantine.
Eur J Clin Nutr, 74 (2020), pp. 850-851
[21]
J. Ye, L. Yang, X. Xi, X. Lin, D. He, W. Wang.
Avoiding hospital-related infections during the COVID-19 epidemic.
[22]
S. Rees, A. Williams.
Promoting and supporting self-management for adults living in the community with physical chronic illness: a systematic review of the effectiveness and meaningfulness of the patient-practitioner encounter.
JBI Libr Syst Rev, 7 (2009), pp. 492-582
[23]
L. Montefusco, M. Ben Nasr, F. D’Addio, et al.
Acute and long-term disruption of glycometabolic control after SARS-CoV-2 infection.
Nat Metab, 3 (2021), pp. 774-785
[24]
Servicio Canario de Salud.
Gerencia de Atención Primaria de Gran Canaria. Memoria de Actividad 2020 GAPGC – Indicadores PGC.
(2020),
[25]
Gobierno de Canarias.
Guía de actuación. Pie diabético en Canarias. Consejería de Sanidad. Servicio Canario de la Salud.
Dirección General de Programas Asistenciales, (2017), pp. 33-40
[26]
Posicionamiento de los municipios mayores de 1.000 habitantes por Renta bruta media.
Agencia Estatal de Administración Tributaria, (2020),
[27]
Organisation for Economic Co-operation and Development.
OECD. Under Pressure: The Squeezed Middle Class.
(2019),
[28]
S. Daria.
Análisis de las desigualdades económicas en la prevalencia de la diabetes y la obesidad en Canarias.
ENE Rev Enf, 4 (2008), pp. 51-60
[29]
V. Gimeno-Hernández Garza, I. Antoñanzas Torres, E. Pitarch Roca, M. Vázquez Sánchez, M. Ferrer Lozano, A. de Arriba Muñoz.
Influence of the SARS-CoV-2 pandemic on paediatric patients with type 1 diabetes mellitus after one year of follow-up.
J Pediatr Endocrinol Metab, 35 (2022), pp. 867-873
[30]
N.-C. Ginés, M. Lander, C. Huseyin, et al.
Clase social, bienestar y afectividad general durante la pandemia de COVID-19 en Iberoamérica.
Escritos de Psicología, 14 (2021), pp. 84-95
[31]
E. Valero Alzaga, U. Martín Roncero, A. Domínguez-Rodríguez, et al.
Covid-19 y salud infantil: el confinamiento y su impacto según profesionales de la infancia.
Rev Esp Salud Publica, 94 (2020), pp. 1-7
[32]
C. Jacques-Aviñó, T. López-Jiménez, L. Medina-Perucha, et al.
Gender-based approach on the social impact and mental health in Spain during COVID-19 lockdown: a cross-sectional study.
BMJ Open, 10 (2020), pp. e044617
[33]
Y. González-Rábago, A. Cabezas-Rodríguez, U. Martín.
Social inequalities in health determinants in Spanish children during the COVID-19 lockdown.
Int J Environ Res Public Health, 18 (2021), pp. 4087
[34]
J.M. Ordovás, M. Esteban, R. García-Retamero, et al.
Informe del Grupo de Trabajo Multidisciplinar sobre Desigualdades y Covid-19.
Ministerio de Ciencia e Innovación de Spain, (2021), http://dx.doi.org/10.20350/digitalCSIC/13852
[35]
M. Martinez-Bravo, C. Sanz.
Inequality and psychological well-being in times of COVID-19: evidence from Spain.
SERIEs, 12 (2021), pp. 489-548
[36]
Ministerio de Sanidad.
Equidad en salud y COVID-19: Análisis y propuestas para abordar la vulnerabilidad epidemiológica vinculada a las desigualdades sociales.
Ministerio de Sanidad, (2020),
[37]
E. Robinson, E. Boyland, A. Chisholm, et al.
Obesity, eating behavior and physical activity during COVID-19 lockdown: a study of UK adults.
Appetite, 156 (2021), pp. 104853
[38]
D.A. de Luis Román, O. Izaola, D. Primo Martín, E. Gómez Hoyos, B. Torres Torres, J.J. López Gómez.
Effect of lockdown for COVID-19 on self-reported body weight gain in a sample of obese patients.
Nutr Hosp, 37 (2020), pp. 1232-1237
[39]
C. Rodríguez-Pérez, E. Molina-Montes, V. Verardo, et al.
Changes in dietary behaviours during the COVID-19 outbreak confinement in the Spanish COVIDiet Study.
Nutrients, 12 (2020), pp. 1730
[40]
L.I. Sinisterra Loaiza, B. Vázquez Belda, J.M. Miranda López, A. Cepeda, A. Cardelle Cobas.
Hábitos alimentarios en la poblacion gallega durante el confinamiento por la COVID-19.
Nutr Hosp, 37 (2020), pp. 1190-1196
[41]
J. Fernandez-Rio, J.A. Cecchini, A. Mendez-Gimenez, A. Carriedo.
Weight changes during the COVID-19 home confinement. Effects on psychosocial variables.
Obes Res Clin Pract, 14 (2020), pp. 383-385
[42]
M. López-Moreno, M.T.I. López, M. Miguel, M. Garcés-Rimón.
Physical and psychological effects related to food habits and lifestyle changes derived from covid-19 home confinement in the Spanish population.
Nutrients, 12 (2020), pp. 3445
[43]
D.R. Bakaloudi, R. Barazzoni, S.C. Bischoff, J. Breda, K. Wickramasinghe, M. Chourdakis.
Impact of the first COVID-19 lockdown on body weight: a combined systematic review and a meta-analysis.
Clin Nutr, 41 (2022), pp. 3046-3054
Copyright © 2025. Sociedad Española de Cardiología
Descargar PDF
Idiomas
REC: CardioClinics
Opciones de artículo
Herramientas
es en

¿Es usted profesional sanitario apto para prescribir o dispensar medicamentos?

Are you a health professional able to prescribe or dispense drugs?