


Computed tomography of coronary arteries (CTCA) is emerging as the gold standard in the initial evaluation of chest pain. The aim of this study is to calculate the diagnostic performance and clinical usefulness of numerical models of arterial channels flow to assess non-invasive coronary fractional flow reserve by computed tomography (FFRct) compared to assessment by invasive angiography (FFR).
MethodsComputation of FFR from CTCA images was performed on 39 vessels in 32 patients who followed the usual clinical protocol including invasive coronary angiography and FFR following the usual clinical protocol. From the segmentation of the CTCA images, 3D geometry is obtained, and computational fluid dynamics techniques are applied to accurately reproduce the circulation of blood considering steady and unsteady circulatory conditions. Additional parameters as wall shear stress, stenosis resistance index and ΔFFRct were also calculated.
ResultsThe results obtained show a good correlation between FFRct and invasive FFR, without obtaining false positives values. In addition, no differences were observed between the simulations considering steady conditions or those considering the transient. Additional parameters as wall shear stress, stenosis resistance, and ΔFFRct also showed a good correlation with the invasive values.
ConclusionsThis new model for calculating the FFRct from non-invasive 3D medical images of coronary tree has shown good agreement with those obtained using invasive techniques. Parameters as wall shear stress, stenosis resistance and ΔFFRct provide useful information that could be helpful in medical decision-making in those situations with FFR values close to the cut-off zone.
La tomografía computarizada de arterias coronarias (TCAC) se perfila como el estándar de oro en la evaluación inicial del dolor torácico. El objetivo de este estudio es evaluar el rendimiento diagnóstico y la utilidad clínica de los modelos numéricos de flujo de los canales arteriales para evaluar la reserva fraccional de flujo coronario no invasiva, mediante tomografía computarizada (FFRtc) en comparación con la evaluación mediante angiografía invasiva (FFR).
MétodosSe realizó el cálculo de FFR a partir de imágenes de TCAC en 39 vasos de 32 pacientes que siguieron el protocolo clínico habitual, incluida la angiografía coronaria invasiva y la FFR. A partir de la segmentación de las imágenes TCAC, se obtuvo la geometría 3D y se aplicaron técnicas de dinámica de fluidos computacional para reproducir con precisión la circulación de la sangre, considerando condiciones circulatorias estables e inestables. También se calcularon parámetros adicionales como la tensión de cizallamiento de la pared, el índice de resistencia a la estenosis y el ΔFFRtc.
ResultadosLos resultados obtenidos muestran una buena correlación entre la FFRtc y la FFR invasiva, sin obtenerse falsos positivos. Además, no se observaron diferencias entre las simulaciones considerando condiciones estacionarias o las que consideraron transitorias. Parámetros adicionales como la tensión de cizallamiento de la pared, el índice de resistencia a la estenosis y el ΔFFRtc también mostraron una buena correlación con los valores invasivos.
ConclusionesEste nuevo modelo para el cálculo de la FFRtc a partir de imágenes médicas 3D no invasivas del árbol coronario ha mostrado una buena concordancia con las obtenidas mediante técnicas invasivas. Parámetros como la tensión de cizallamiento de la pared, el índice de resistencia a la estenosis y ΔFFRtc brindan información útil que podría ayudar en la toma de decisiones médicas en aquellas situaciones con valores de la FFR cercanos a la zona de corte.
The results from the ISCHEMIA study show that for patients with coronary artery disease documented by computed tomography of coronary arteries (CTCA) and inducible ischemia of at least moderate degree, an initial invasive strategy as compared with a conventional one did not reduce the risk of coronary artery disease.1 In this context, a technique such as the fractional flow reserve (FFR) obtained from a CTCA (FFRct) would be tremendously useful, since it would combine anatomical and functional information on coronary heart disease in the same test, with the consequent economic savings, increase of the well-being of the patient, and accelerate the obtention of the results, since no more studies are required than a CTCA. The recent FORECAST study where a FFRct-based strategy was compared to a standard one in low-risk patients without finding differences in events between the two groups, would validate this hypothesis.2 Although some of these types of models have already been validated, research around this computational FFR measurement is a very active and competitive field today. In addition to the FFR, other types of variables can be obtained and used to assess coronary risk. Wall shear stress (WSS), stenosis resistance (SR), and ΔFFRct evaluate the coronary risk and the severity of the lesions and complement the calculation of the FFR, which is the gold standard for diagnostic accuracy studies as well as in clinical decision making.
Due to the complexity of the problem, different approaches have been proposed that can be divided in three paradigms: reduced order models, three-dimensional (3D) computer fluid dynamic simulation (full order models) or machine learning models.3
The most promising option and the one our paper will focus in is a 3D full-order model with computer fluid simulations and model reconstruction by CTCA images. A full-order mathematical model with these characteristics will be complex enough to characterize the blood flow in the coronary arteries, which allows to perform deeper studies in which the ischemia risk could be assessed not only by the FFR calculation, but also complemented with a WSS study. This kind of method has proved its performance in small studies, but there is not a major study that fully validates it.4
MethodsStudy populationWe included patients referred from the emergency department by the chest pain unit for ischemic heart disease screening, selecting for invasive study those with at least 1 coronary lesion >50% in the CTCA. Patients with subocclusive disease, previously implanted stent in the interrogated branch, or very severe calcification that impeded adequate CTCA interpretation were excluded. The inclusion period was from January 2021 to June 2022. STROBE guidelines have been followed
Ethics statementThe development of the project was carried out respecting the Declaration of Helsinki of the World Medical Association 1964 and ratifications of the following assemblies (Tokyo 75, Venice 83, Hong Kong 89, Somerset West 96, Scotland 00, Seoul 08 and Fortaleza 13) on ethical principles for medical research on human beings, RD 1090/2015, of December 24, on clinical trials, specifically the provisions of article 38 on good clinical practices, and the convention on human rights and biomedicine, made in Oviedo on April 4, 1997 and successive updates.
The clinical data of the patients will be collected by the investigator in the case report form (CRF) specific to the study. Each CRF will be encrypted, protecting the identity of the patient. Only information that cannot be identified may be transmitted to third parties. Once the study is finished, the data will be destroyed. All included patients were informed and signed the informed consent.
The Research Ethics Committee of Santiago de Compostela-Lugo has approved this study and has set the conditions for sharing the data used in its development.
Possible sex and gender variables have been taken into account in accordance with the SAGER guidelines.
Procedure protocolCTCA images were obtained with a 1-beat 16-cm wide coverage and a 0.23mm spatial resolution (Revolution CT, GE Healthcare, United States).5 Acquisition parameters and patient premedication were chosen following the Society of Cardiovascular Computed Tomography recommendations. Invasive FFR was measured according to standard practice. Analogous to the invasive FFR, FFRct ≤0.80 was considered positive. To eliminate possible biases, the results of the invasive FFR were unknown at the time of applying this new model to obtain the FFRct value.
Numerical simulationsPatient model reconstruction (3D geometry)The 3D geometry construction was done using the software Slicer 3D.6 The main goal of the segmentation process is to obtain a 3D geometry of the coronary tree that represents the fluid domain inside the blood vessels. To reach this configuration, it is necessary to select an appropriate threshold that removes other domain structures (such as calcifications, stents, or other type of atherosclerotic plaque). These structures cause a decrease in the caliber of the vessel and have a great influence on the behavior of blood flow. In the case of stents, it is often difficult to accurately determine the caliber of the vessel because the mesh (often made of a metallic material) covers the entire internal diameter and makes difficult to see the inner region. For this reason, the treatment of these structures will be carried out in two different ways: (a) if the stent is placed in the same main branch (right coronary artery or left main stem) in which the FFR is calculated, it is considered that the case is not valid for the analysis and it is discarded, whereas (b) if the stent is placed in the opposite main branch of the coronary tree where the FFR calculation is being carried out, it is considered that the vessel affected by the stent is healthy, and the entire diameter is considered as a blood vessel caliber. We consider that the stent has a great influence on the distribution of flows when located in the same vessel in which FFR is calculated but the influence decreases when it is in a region far away from the calculation area.
MeshNumerical simulations were carried out using the commercial computer fluid dynamic simulation software Simcenter StarCCM+ (Siemens, Germany).7 This software allows the creation of a tetrahedral mesh refined near the walls with hexahedral layers where grids area clustered in radial direction to improve the accuracy in regions with high velocity gradients. An example of the mesh grid is shown in Fig. 1.

Three grids with different grid density and size were considered for each of the patients and calculations were performed for each one of them. Table 1 summarizes the obtained results for a single patient.
As the error made between meshes is less than 5%, mesh 1 is used as a reference as it is the most efficient in terms of computational time.
Boundary conditionsSteady and transient state simulations have been carried out and different inlet and outlet conditions were used in each case.
Inlet boundary conditionsThe same inlet pulsatile profile was used for all patients to perform the non-stationary analysis. We considered a pulsatile pulse pressure whose profile is defined in Fig. 2.8

Under steady state conditions, mean arterial pressure (MAP) is used as inlet condition and it is calculated based on the patient's own data obtained in a non-invasive way,
with SBP and DBP are the systolic and diastolic blood pressures, respectively.Outlet boundary conditionsUnsteady simulations
In the present study a 3-element Windkessel model was used to model outlet blood pressure.9 During the cardiac cycle, the 3-element Windkessel model considers the effect of arterial compliance and total peripheral resistance. Thus, the relation between pressure and flow is defined by the equation:
where Q(t) is the time dependent flow, Rp and Rd are the proximal and distal resistances, respectively, P(t) is a time dependent pressure and C is the capacitance.
To estimate coronary compliance, we proceed as follows: (a) we obtain the time decay (τ) by multiplying each resistance by their compliance, extracted from.10 This is a reference τ for each type of vessel; (b) the resistance of our vessel is calculated following R=pa/dk. To obtain the proximal and distal resistance, values of 0.09 and 0.91, respectively, have been chosen; (c) to calculate each coronary compliance, we divide the time decay constant of each vessel by their distal resistance.11
Steady simulationsFor steady simulations, an implicit algorithm based on was applied to the outlets with a relaxation factor12
where P is the pressure (Pa), α relaxation factor, R resistance ((Pas)/m3) and Q the blood flow (m3).
Note that, in both cases (transient and steady state simulations), for the calculation of peripheral resistance the patient's physiological mean pressure obtained from systolic and diastolic pressure measurements is considered.
Simulation detailsStarCCM+ solves the governing Navier–Stokes equations using a finite volume method. Reynolds numbers smaller than 200 were considered for each configuration (thus laminar flow is always granted) and convergence criteria was defined as the time in which computed variables as FFR remain invariable. At the same time, circulating blood was considered as a Newtonian fluid with a density of 1060kg/m3 and a dynamic viscosity of 0.004Pas, with no-slip condition at the vessel rigid walls. SIMPLE algorithm was used for pressure-velocity coupling and second-order upwind discretization schemes are used for the conservation of mass and momentum.
Non-invasive coronary fractional flow reserve by computed tomographyIt is important to point out that the numerical method allows to obtain the patients’ state with a single image, not only where the FFR was obtained via the catheterization, but for all the vessels. The FFRct is calculated considering the same measurement zones as the invasive-FFR. Thus, aortic pressure is measured in the aorta (close to the ostium) and the pressure in the coronary vessel is usually measured 1–2cm distal to the lesion.
FFRct was obtained under steady and unsteady conditions, and in basal and hyperemic states. To evaluate coronary risk, different parameters were defined analyzed in the computational environment such as FFR, WSS, SR and ΔFFRct. These last four parameters evaluate the coronary risk and the severity of the lesions and complement the calculation of the FFR, which is the gold standard for diagnostic accuracy studies as well as in clinical decision making.
WSS is a widely used parameter to determine which zones are more prone to form plaque. This magnitude accounts for the frictional forces between the circulating flow and the vessel walls, and it becomes zero when the flow stops. Blood vessel walls with low shear stress are more likely to deposit plaque and thus develop atherosclerosis. Furthermore, high WSS is located at the top portion of maximal stenosis, and it is related to the risk of plaque rupture and induce specific changes in cell behavior that have potential to exacerbate inflammation and promote progression of the atherosclerotic lipid core.13,14 On the other hand, the WSS is highly sensitive to the measurement location. WSS in the constricted area of the stenosis increases as the flow velocity increases and thus, FFR decreases. WSS could be a good complement to the FFR due to this relationship that exists between both variables in areas of great narrowing (stenosis).
The calculation of the SR index combines pressure with flow measurements:
where p¯a and p¯d are the mean aortic pressure and mean distal pressure, and APV is the average peak flow velocity, measured distal to the coronary lesion. This index was calculated under hyperemic (HSR) and basal (BSR) conditions.
Some authors propose that the combination of this index with the FFR improves the precision of the treatment and detection of severe stenosis.15
Finally, ΔFFRct is defined as the change in FFRct throughout the lesion. This parameter is defined for each lesion by computing the difference between the proximal and distal FFRct values.16 To evaluate ΔFFRct, two locations are analyzed: distal to the lesion, the same plane where the pressure used to compute the FFRct is evaluated and proximal to the lesion (1cm from the stenosis).
It is important to note that the FFRct computation process requires low computational time (1h–3h). Furthermore, all the parameters described above can be calculated with a single computational. It is therefore a time-efficient system that can heslp clinicians make decisions quickly.
Invasive FFRThe calculation of invasive FFR was performed using a depression guide and intravenous administration of adenosine as per usual practice. This was performed within the first 15 days after the CT study.
Statistical analysisTo evaluate the agreement between invasive-FFR and FFRct, Bland–Altman analysis was performed. Bland–Altman limits of agreement (±1.96 standard deviation) were used as the error range. R2 was calculated and Pearson coefficient was used to calculate correlation between different variables considered in the study. Analysis was performed using SPSS 22 (IBM Corp, United States).
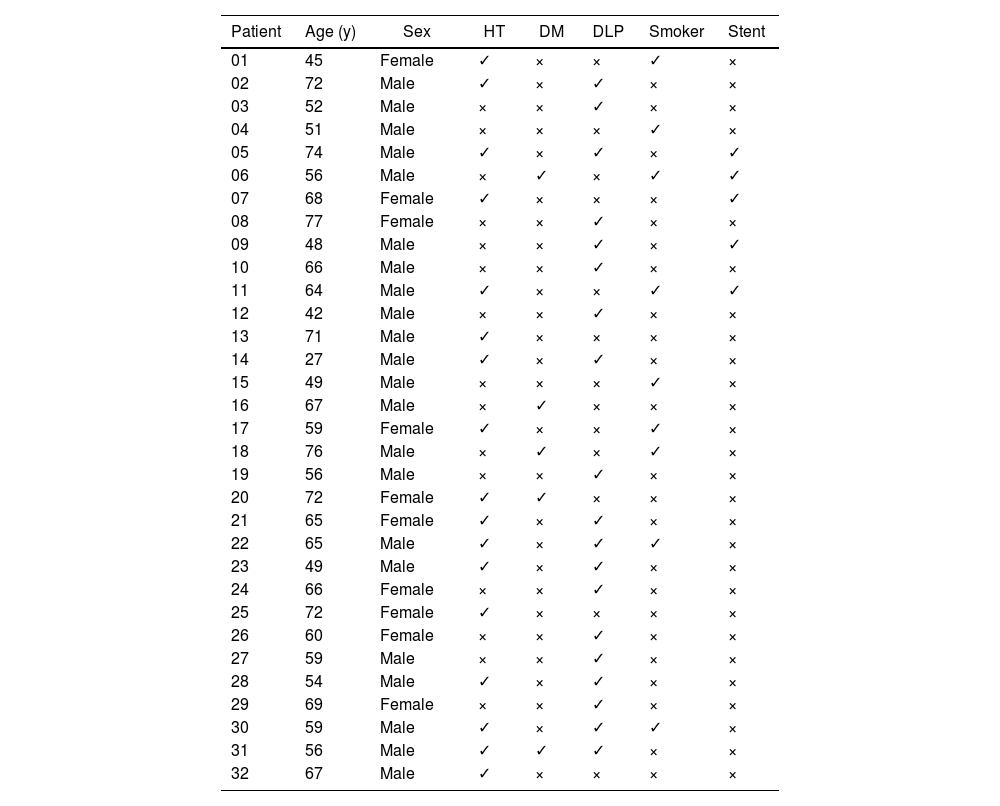
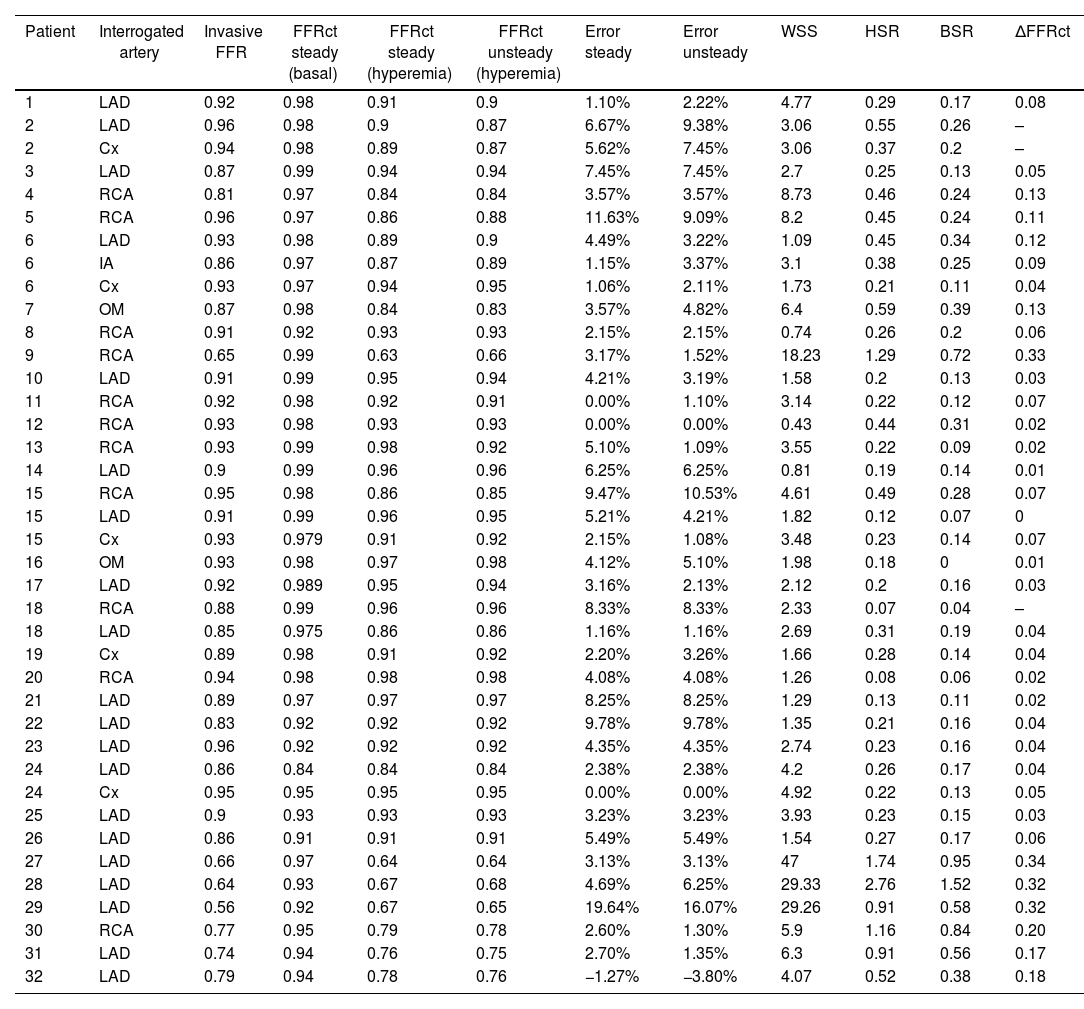
ResultsA total of 32 patients of different ages and pathologies were recruited and their characteristics are specified in Table 2. Fig. 3 shows the FFRct calculated at all the locations of the coronary tree. Fig. 4A plots the correlation between FFRct under steady hyperemic conditions and invasive-FFR, and agreement between both values is shown in Fig. 4B. Both images show the good agreement between the numerical and the invasive methods. Note that the FFR values for most lesions are above the cut-off value of 0.80 since the main objective of the study was the evaluation of intermediate coronary lesions. Characteristics of these lesions can be observed in Table 1 of the supplementary data. Results obtained considering unsteady conditions with a pulse pressure as inlet condition and Windkessel model in outlets are very similar to those obtained under steady state conditions (Table 3). Thus, numerical analysis in steady conditions could be carried out to analyze non-time dependent variables as FFR with a significant reduction in computing time and without any loss of accuracy. Table 4 summarizes the main correlation coefficients between these parameters and the invasive FFR. For all cases, except for FFRct, WSS, HSR and ΔFFRct, it shows a negative correlation with FFR. The best correlation coefficients are obtained for FFRct and ΔFFRct. HSR and BSR show similar correlation coefficients as expected.17 Correlation between ΔFFRct and FFR is large. There was also a very good correlation between WSS and invasive FFR under basal conditions that are in good agreement with other previous studies.18 Different correlations between FFRct and the other variables considered in this study are plotted in Figure 1 of the supplementary data.
Basal characteristics of the patients.
| Patient | Age (y) | Sex | HT | DM | DLP | Smoker | Stent |
|---|---|---|---|---|---|---|---|
| 01 | 45 | Female | ✓ | × | × | ✓ | × |
| 02 | 72 | Male | ✓ | × | ✓ | × | × |
| 03 | 52 | Male | × | × | ✓ | × | × |
| 04 | 51 | Male | × | × | × | ✓ | × |
| 05 | 74 | Male | ✓ | × | ✓ | × | ✓ |
| 06 | 56 | Male | × | ✓ | × | ✓ | ✓ |
| 07 | 68 | Female | ✓ | × | × | × | ✓ |
| 08 | 77 | Female | × | × | ✓ | × | × |
| 09 | 48 | Male | × | × | ✓ | × | ✓ |
| 10 | 66 | Male | × | × | ✓ | × | × |
| 11 | 64 | Male | ✓ | × | × | ✓ | ✓ |
| 12 | 42 | Male | × | × | ✓ | × | × |
| 13 | 71 | Male | ✓ | × | × | × | × |
| 14 | 27 | Male | ✓ | × | ✓ | × | × |
| 15 | 49 | Male | × | × | × | ✓ | × |
| 16 | 67 | Male | × | ✓ | × | × | × |
| 17 | 59 | Female | ✓ | × | × | ✓ | × |
| 18 | 76 | Male | × | ✓ | × | ✓ | × |
| 19 | 56 | Male | × | × | ✓ | × | × |
| 20 | 72 | Female | ✓ | ✓ | × | × | × |
| 21 | 65 | Female | ✓ | × | ✓ | × | × |
| 22 | 65 | Male | ✓ | × | ✓ | ✓ | × |
| 23 | 49 | Male | ✓ | × | ✓ | × | × |
| 24 | 66 | Female | × | × | ✓ | × | × |
| 25 | 72 | Female | ✓ | × | × | × | × |
| 26 | 60 | Female | × | × | ✓ | × | × |
| 27 | 59 | Male | × | × | ✓ | × | × |
| 28 | 54 | Male | ✓ | × | ✓ | × | × |
| 29 | 69 | Female | × | × | ✓ | × | × |
| 30 | 59 | Male | ✓ | × | ✓ | ✓ | × |
| 31 | 56 | Male | ✓ | ✓ | ✓ | × | × |
| 32 | 67 | Male | ✓ | × | × | × | × |
HT, hypertension; DM, diabetes mellitus; DLP, dyslipidemia.

FFRct calculated for the coronary tree of patients 01 and 02 under steady hyperemic conditions. FFR, fractional flow reserve. Left column shows the FFRct for the whole coronary tree where some representative values are indicated. Right column focus on the branch where the invasive FFR was obtained.
 and Bland–Altman plot (B).")
Values of invasive FFR, FFRct (under basal and hyperemic conditions), WSS, SR and ΔFFRct.
| Patient | Interrogated artery | Invasive FFR | FFRct steady (basal) | FFRct steady (hyperemia) | FFRct unsteady (hyperemia) | Error steady | Error unsteady | WSS | HSR | BSR | ΔFFRct |
|---|---|---|---|---|---|---|---|---|---|---|---|
| 1 | LAD | 0.92 | 0.98 | 0.91 | 0.9 | 1.10% | 2.22% | 4.77 | 0.29 | 0.17 | 0.08 |
| 2 | LAD | 0.96 | 0.98 | 0.9 | 0.87 | 6.67% | 9.38% | 3.06 | 0.55 | 0.26 | – |
| 2 | Cx | 0.94 | 0.98 | 0.89 | 0.87 | 5.62% | 7.45% | 3.06 | 0.37 | 0.2 | – |
| 3 | LAD | 0.87 | 0.99 | 0.94 | 0.94 | 7.45% | 7.45% | 2.7 | 0.25 | 0.13 | 0.05 |
| 4 | RCA | 0.81 | 0.97 | 0.84 | 0.84 | 3.57% | 3.57% | 8.73 | 0.46 | 0.24 | 0.13 |
| 5 | RCA | 0.96 | 0.97 | 0.86 | 0.88 | 11.63% | 9.09% | 8.2 | 0.45 | 0.24 | 0.11 |
| 6 | LAD | 0.93 | 0.98 | 0.89 | 0.9 | 4.49% | 3.22% | 1.09 | 0.45 | 0.34 | 0.12 |
| 6 | IA | 0.86 | 0.97 | 0.87 | 0.89 | 1.15% | 3.37% | 3.1 | 0.38 | 0.25 | 0.09 |
| 6 | Cx | 0.93 | 0.97 | 0.94 | 0.95 | 1.06% | 2.11% | 1.73 | 0.21 | 0.11 | 0.04 |
| 7 | OM | 0.87 | 0.98 | 0.84 | 0.83 | 3.57% | 4.82% | 6.4 | 0.59 | 0.39 | 0.13 |
| 8 | RCA | 0.91 | 0.92 | 0.93 | 0.93 | 2.15% | 2.15% | 0.74 | 0.26 | 0.2 | 0.06 |
| 9 | RCA | 0.65 | 0.99 | 0.63 | 0.66 | 3.17% | 1.52% | 18.23 | 1.29 | 0.72 | 0.33 |
| 10 | LAD | 0.91 | 0.99 | 0.95 | 0.94 | 4.21% | 3.19% | 1.58 | 0.2 | 0.13 | 0.03 |
| 11 | RCA | 0.92 | 0.98 | 0.92 | 0.91 | 0.00% | 1.10% | 3.14 | 0.22 | 0.12 | 0.07 |
| 12 | RCA | 0.93 | 0.98 | 0.93 | 0.93 | 0.00% | 0.00% | 0.43 | 0.44 | 0.31 | 0.02 |
| 13 | RCA | 0.93 | 0.99 | 0.98 | 0.92 | 5.10% | 1.09% | 3.55 | 0.22 | 0.09 | 0.02 |
| 14 | LAD | 0.9 | 0.99 | 0.96 | 0.96 | 6.25% | 6.25% | 0.81 | 0.19 | 0.14 | 0.01 |
| 15 | RCA | 0.95 | 0.98 | 0.86 | 0.85 | 9.47% | 10.53% | 4.61 | 0.49 | 0.28 | 0.07 |
| 15 | LAD | 0.91 | 0.99 | 0.96 | 0.95 | 5.21% | 4.21% | 1.82 | 0.12 | 0.07 | 0 |
| 15 | Cx | 0.93 | 0.979 | 0.91 | 0.92 | 2.15% | 1.08% | 3.48 | 0.23 | 0.14 | 0.07 |
| 16 | OM | 0.93 | 0.98 | 0.97 | 0.98 | 4.12% | 5.10% | 1.98 | 0.18 | 0 | 0.01 |
| 17 | LAD | 0.92 | 0.989 | 0.95 | 0.94 | 3.16% | 2.13% | 2.12 | 0.2 | 0.16 | 0.03 |
| 18 | RCA | 0.88 | 0.99 | 0.96 | 0.96 | 8.33% | 8.33% | 2.33 | 0.07 | 0.04 | – |
| 18 | LAD | 0.85 | 0.975 | 0.86 | 0.86 | 1.16% | 1.16% | 2.69 | 0.31 | 0.19 | 0.04 |
| 19 | Cx | 0.89 | 0.98 | 0.91 | 0.92 | 2.20% | 3.26% | 1.66 | 0.28 | 0.14 | 0.04 |
| 20 | RCA | 0.94 | 0.98 | 0.98 | 0.98 | 4.08% | 4.08% | 1.26 | 0.08 | 0.06 | 0.02 |
| 21 | LAD | 0.89 | 0.97 | 0.97 | 0.97 | 8.25% | 8.25% | 1.29 | 0.13 | 0.11 | 0.02 |
| 22 | LAD | 0.83 | 0.92 | 0.92 | 0.92 | 9.78% | 9.78% | 1.35 | 0.21 | 0.16 | 0.04 |
| 23 | LAD | 0.96 | 0.92 | 0.92 | 0.92 | 4.35% | 4.35% | 2.74 | 0.23 | 0.16 | 0.04 |
| 24 | LAD | 0.86 | 0.84 | 0.84 | 0.84 | 2.38% | 2.38% | 4.2 | 0.26 | 0.17 | 0.04 |
| 24 | Cx | 0.95 | 0.95 | 0.95 | 0.95 | 0.00% | 0.00% | 4.92 | 0.22 | 0.13 | 0.05 |
| 25 | LAD | 0.9 | 0.93 | 0.93 | 0.93 | 3.23% | 3.23% | 3.93 | 0.23 | 0.15 | 0.03 |
| 26 | LAD | 0.86 | 0.91 | 0.91 | 0.91 | 5.49% | 5.49% | 1.54 | 0.27 | 0.17 | 0.06 |
| 27 | LAD | 0.66 | 0.97 | 0.64 | 0.64 | 3.13% | 3.13% | 47 | 1.74 | 0.95 | 0.34 |
| 28 | LAD | 0.64 | 0.93 | 0.67 | 0.68 | 4.69% | 6.25% | 29.33 | 2.76 | 1.52 | 0.32 |
| 29 | LAD | 0.56 | 0.92 | 0.67 | 0.65 | 19.64% | 16.07% | 29.26 | 0.91 | 0.58 | 0.32 |
| 30 | RCA | 0.77 | 0.95 | 0.79 | 0.78 | 2.60% | 1.30% | 5.9 | 1.16 | 0.84 | 0.20 |
| 31 | LAD | 0.74 | 0.94 | 0.76 | 0.75 | 2.70% | 1.35% | 6.3 | 0.91 | 0.56 | 0.17 |
| 32 | LAD | 0.79 | 0.94 | 0.78 | 0.76 | −1.27% | −3.80% | 4.07 | 0.52 | 0.38 | 0.18 |
The difference between the invasive FFR value and the FFRct obtained in steady state and unsteady state is detailed in the error steady and error unsteady columns. ΔFFRct, delta fractional flow reserve; BSR, stenoses resistance in basal conditions; Cx, circumflex; FFR, fractional flow reserve; HSR, stenoses resistance in hyperemic conditions; IA, intermediate artery; LAD, left anterior descending; RCA, right coronary artery; OM, obtuse marginal; WSS, wall shear stress.
Pearson r and R2 correlation coefficients for the five computed parameters compared to the invasive FFR.
| FFRct | WSS | HSR | BSR | ΔFFRct | |
|---|---|---|---|---|---|
| Invasive-FFR | 0.88 | −0.79 | −0.76 | −0.78 | −0.89 |
| R2 | 0.78 | 0.62 | 0.58 | 0.60 | 0.79 |
BSR, stenoses resistance in basal conditions; ΔFFRct, delta fractional flow reserve; FFR, fractional flow reserve; HSR, stenoses resistance in hyperaemic conditions; WSS, wall shear stress.
We present the initial results of a new model for calculating the FFRct from non-invasive 3D medical images of the coronary tree, which has shown good agreement with the FFR values obtained using invasive techniques without obtaining false positives. We have also been able to study other parameters such as WSS, HSR, BSR, and ΔFFRct, which provide additional information in the study of coronary disease that could be useful in clinical decision-making in situations with FFR values close to the cut-off zone (0.75≤FFR≤0.80), although its actual clinical utility is yet to be determined.
Ischemic heart disease is a prevalent condition that causes significant morbidity and mortality in developed countries. Stenosis in epicardial coronary arteries are lesions considered for revascularization procedures according to clinical guidelines when they cause significant ischemia or untreatable symptoms.19 Coronary artery stenosis may be assessed anatomically or functionally. Computed tomography of coronary arteries (CTCA) and invasive coronary angiography provide anatomical information but not functional assessment on the effect of the stenosis on the oxygen supply to the myocardium.
In the context of high-risk acute coronary syndrome invasive assessment should be performed to proceed to interventional treatment as soon as possible.20 Conversely, in the context of chronic coronary syndromes, further assessment is advised before an invasive procedure is requested (stent placement or a bypass).21 Functional information has been gaining importance as we get evidence on better results of revascularization when guided by functional tests and particularly FFR.22–26
Despite the usefulness of the evaluation of the coronary lesion by FFR technique, this method has great disadvantages, such us the need to administer medication to the patient, the use of an operating room and patient hospitalization, plus the time of the specialized clinical staff. In addition to the FFR, other types of variables can be used to assess coronary risk. Time averaged WSS (TAWSS) and oscillatory shear index are well known as primary risk parameters for the development and progression of atherosclerosis which can further lead to various types of coronary stenosis.27–30 Recent studies have discovered that low TAWSS (≤4dynes/cm2) and high oscillatory shear index (≥0.15) are risk factors for rupture-prone phenotype, which may be related to lipid accumulation and inflammatory cell infiltration to the intima.31,32 Therefore, the evaluation of hemodynamic parameters in the epicardial coronary arterial tree is very important to understand the progression of atherosclerosis as well as high-risk areas for plaque formation.
The mathematical modeling of the circulatory system and its processes is a field with more than a hundred-year trajectory. The development of computer science and the possibility of its implementation in daily medical practice is what has really taken the mathematical representation of physiological systems to the next level. The FFR is one of the parameters derived from a mathematical model. The simplicity of its theoretical formulation – it is a pressure ratio – makes this parameter ideal to be calculated by computational methods.
Along the text, a detailed mechanism to calculate the FFRct from non-invasive 3D medical images of the coronary tree has been presented.
The results obtained are in good agreement with those obtained via catheterization using invasive techniques. Based on the detailed simulation of the artery flow, additional parameters are defined in this context providing complementary information in good agreement with the experimentally calculated FFR. In particular, the values of WSS calculated by the non-invasive technique provide complementary and meaningful information. The results were discussed in terms of the hyperemic and basal conditions. Much better correlation coefficients with FFR were obtained under basal conditions and for a WSS measured inside the stenosis. Additional parameters are also calculated (WSS, HSR, BSR, and ΔFFRct) showing a good agreement with the invasive results (good correlation with invasive FFR) and provide useful information that could be helpful in medical decision-making in those situations with FFR values close to the cut-off zone (0.75≤FFR≤0.80).
Nowadays most companies involved in cardiac imaging, and particularly in cardiac CT, have been searching for a whole non-invasive solution for a complete ischemic heart disease assessment to be competitive in this rapidly evolving market.33 Some companies are developing fusion software that allows to analyze anatomical CTCA images and functional myocardial perfusion single photon emission computed tomography/positron emission tomography images together (i.e., the CardiacIQ Fusion software package from General Electric, United States), but this solution does not reduce the need for two different tests to be performed, most of the time on different days.34,35 Other companies have promoted the development of stress CT to be acquired on the same scanner as the anatomical CTCA dataset, but this strategy still implies extra doses of radiation, contrast, and medication.36 The next step taken by CT companies has been to include a non-invasive FFR calculation on their packages. Up to now, this solution has not been widely spread mostly due to restrictions in commercialization of the first FFRct models, leaving market field for new solutions.
ConclusionsThis new model for calculating the FFRct from non-invasive 3D medical images of coronary tree has shown good agreement with those obtained using invasive techniques at values above 0.80 without obtaining false positives, Although the correlation between the FFR and the FFRct is also good when it is ≤0.80, more patients should be included for its correct validation in this type of patient since there could show increased scatter of computational FFR techniques for low wire-based FFR values. The additional parameters calculated (WSS, HSR, BSR, and ΔFFRct), showed good agreement with the invasive results (good correlation with invasive FFR) and provide information that could be useful in medical decision-making in those situations with FFR values close to the cut-off zone (0.75≤FFR≤0.80). Their actual clinical utility is yet to be determined although the results observed are promising.
- -
The investigation of models that allow the non-invasive functional evaluation of coronary lesions is a booming field due to its important clinical implications.
- -
Currently there is only one model validated and approved for use in clinical practice, available in less than 10 countries and at a high cost.
- -
Our initial results support the validity of our model in the non-invasive functional study of coronary lesions.
- -
Carrying out a clinical trial that confirms these first findings, and its subsequent commercialization, will facilitate the incorporation of this type of study into routine clinical practice with the consequent cost and time savings for the patient and the healthcare system.
Project funded by Sociedad Española de Cardiología (SEC/FEC-INV-CLI 22/04). We gratefully acknowledge financial support by the Ministerio de Economía y Competitividad of Spain and European Regional Development Fund under contract RTI2018-097063-B-I00 AEI/FEDER, UE, by Xunta de Galicia under Research Grant No. 2021-PG036 and by the Spanish Ministerio de Ciencia e InnovaciónMCIN/AEI/10.13039/501100011033 and European Union NextGenerationEU/PRTR. Research grant No: DIN2020-011068. All these programs are co-funded by FEDER (UE).
Ethical considerationsThe Research Ethics Committee of Santiago de Compostela-Lugo has approved this study and has set the conditions for sharing the data used in its development. All included patients were informed and signed the informed consent. Possible sex and gender variables have been taken into account in accordance with the SAGER guidelines. STROBE guidelines have been followed.
Statement on the use of artificial intelligenceNo artificial intelligence tools have been used to carry out this work.
Authors’ contributionsD. López-Otero, A. Otero-Cacho, V.P. Muñuzuri, A. Pérez Muñuzuri, J.R. González-Juanatey: manuscript drafting and supervisión. M. Insúa Villa: computational study. B. Díaz-Fernández, M. Bastos-Fernández: computerized tomography studies. All authors approved the final version of the paper.
Conflicts of interestNone declared.
The following are the supplementary data to this article: