Physical examination is useful for detecting cardiac murmurs in patients with suspected aortic stenosis (AS). Our aim was to evaluate the correlation between physical findings, peripheral artery Doppler, and the echocardiographic parameters of severity in patients with AS.
MethodsBetween August 2017 and January 2018, patients diagnosed with AS (peak velocity >2.5m/s) were prospectively included, and classified into severe (effective orifice area [EOA] <1cm2) and non-severe AS (EOA ≥1cm2). A cardiologist, blinded to the echocardiographic findings, performed a complete physical examination, and then another cardiologist, blinded to previous data, examined the patients to evaluate interobserver variability. A brachial artery Doppler was also performed.
ResultsEighty-six patients were included (mean age 76±9 years, 48% women), of which 49 (57%) had non-severe, and 37 (43%) severe AS. Murmur intensity (r=−0.32; P=.003) and duration (r=−0.54; P<.001) correlated with EOA. Absence of second heart sound was the parameter with higher AUC=0.85; P<.001), late-systole murmur duration (AUC=0.79, P<.001) and pulsus tardus ≥2 (AUC=0.77, P<.001) for severe AS. A cut-off value of 84ms in acceleration time in brachial artery had a sensitivity of 46%, specificity of 87% for severe AS.
ConclusionsPhysical examination findings have an acceptable diagnostic accuracy for assessing AS severity. Prolongation of acceleration time in brachial artery could help assessing AS severity.
La exploración física es útil para la detección de soplos cardiacos en pacientes con sospecha de estenosis aórtica (EA). Nuestro propósito fue evaluar la correlación entre los hallazgos exploratorios, la ecocardiografía Doppler arterial periférica y los parámetros ecocardiográficos de gravedad en pacientes con EA.
MétodosEntre agosto de 2017 y enero de 2018 se incluyó prospectivamente a los pacientes diagnosticados de EA (velocidad máxima >2,5m/s) y se los clasificó en EA grave (área valvular <1cm2) y no grave (área ≥1 cm2). Un cardiólogo que desconocía los hallazgos ecocardiográficos llevó a cabo una exploración física completa, posteriormente otro cardiólogo, sin conocimiento de los datos previos, examinó a los pacientes para evaluar la variabilidad interobservador. Además, se realizó un estudio Doppler de la arterial braquial.
ResultadosSe incluyó a 86 pacientes (edad media: 76±9 años, 48% mujeres), de los que 49 (57%) tenían una EA no grave y 37 (43%) EA grave. La intensidad del soplo (r=−0,32; p=0,003) y la duración (r=−0,54; p<0,001) se correlacionaron con el área valvular. La ausencia del segundo tono fue el parámetro con la mayor área bajo la curva (AUC)=0,85; p<0,001, duración del soplo telesistólico (AUC=0,79; p<0,001) y pulsus tardus ≥2 (AUC=0,77; p<0,001) para EA grave. Un punto de corte de 84ms en el tiempo de aceleración del flujo en la arteria braquial tuvo una sensibilidad del 46% y una especificidad del 87% para una EA grave.
ConclusionesLos hallazgos del examen físico tienen una aceptable seguridad diagnóstica para evaluar la gravedad de la EA. La prolongación del tiempo de aceleración en la arteria braquial podría ayudar a evaluar la gravedad de la EA.
Aortic stenosis (AS) is the most prevalent valve heart disease in adult population.1 Physical examination is clearly useful for the detection of cardiac murmurs, and remains the primary method of initial assessment of patients with suspected AS.
There is scarce information about the correlation between physical examination and echocardiographic findings in patients with AS. The classical physical findings associated with severity of AS were based on studies where rheumatic etiology of AS was more frequent.2 However, the etiology of AS has changed worldwide due to reduction in rheumatic disease and increase in degenerative cause.3
In addition to a systolic murmur in the right upper sternal border, a pulsus parvus et tardus (a small pulse and delayed systolic peak) is well recognized as a clinical finding for severe AS.4 However, there is scarce information about objective measures of pulsus parvus et tardus in AS patients.
Our aim was to evaluate the correlation between physical findings and peripheral artery Doppler, with the echocardiographic severity in patients with AS.
MethodsPatient populationBetween August 2017 and January 2018, we prospectively included consecutive patients diagnosed with AS (peak velocity >2.5m/s) who attended echocardiography laboratory. Exclusion criteria were: age <18 years, ascending aorta less than 25mm, other moderate or severe heart valve disease, significant subaortic or supraaortic stenosis, heart valve prostheses and congenital heart disease (except aortic bicuspid valve). This protocol was approved by our institutional review board.
Physical examinationCardiac physical examination was performed at the initial visit by a cardiologist who was blinded to the echocardiographic results. The following variables were evaluated using a standardized form: Levine scale for grading intensity murmur (from 1 to 6)5; murmur duration (early, middle, or late systole); second heart sound characteristics (present or absent); murmur radiation to the apex or neck; Gallavardin phenomenon (higher frequency of the systolic murmur at the apex),6 delay in carotid upstroke (0=none to 4=severe), decrease in carotid amplitude (0=none to 4=severe).
Clinical dataClinical data included age, sex, arterial hypertension, diabetes, history of smoking, hypercholesterolemia, body mass index, chronic renal failure, and coronary heart disease. Patients manifesting angina, syncope, congestive heart failure or exercise dyspnea class ≥2 were classified as presenting symptoms attributable to AS. Blood pressure was measured at the time of the echocardiographic evaluation.
Echocardiographic examinationTwo-dimensional transthoracic echocardiographic and Doppler studies were obtained with clinical ultrasound machines equipped with 2.5–3.5MHz transducers (iE33 Phillips Medical Systems, The Best, The Netherlands). All tests were conducted by an experienced sonographer. Parasternal long axis view with zoom was used for measuring the aortic annulus diameter in early systole. The time–velocity integral was obtained. Using the pulsed Doppler in the left ventricular outflow tract, placing the sample volume 1cm below the aortic valve. Stroke volume was then calculated assuming a circular shape of the left ventricular outflow tract. Continuous wave Doppler recording of flow through the valve was performed from the 5-chambers and right parasternal windows to record maximal instantaneous and mean pressure gradients across the aortic valve.
Effective orifice area (EOA) was calculated using the continuity equation. An indexed EOA was estimated as EOA/body surface area. Mean transvalvular pressure gradient was obtained with the use of the modified Bernoulli equation. A Doppler velocity index, a simplification of the continuity equation, was calculated as time–velocity integral of left ventricular outflow tract/time–velocity integral of aortic jet. As a measure of global left ventricular afterload, we calculated the valvuloarterial impedance (zva) as (systolic arterial pressure+mean gradient)/systolic volume index.7 We also estimated the systolic work loss with the following formula8:
Acceleration time (AT), ejection time (ET) and AT/ET ratio were also calculated.9
All measurements represent an average of three cardiac cycles for patients in sinus rhythm and at least six cycles if the patient was in a rhythm different from/other than the sinus rhythm. The estimation of extrasystolic beat was always avoided in all cases. Doppler recordings were performed at a sweep speed of 150mm/s.
AS was considered severe when EOA <1cm2, moderate with EOA between 1 and 1.5cm2, and mild if EOA >1.5cm2, according to American guidelines.10
Peripheral brachial artery DopplerThe right brachial artery was imaged approximately 5–10cm proximal to the antecubital fossa in the longitudinal plane. All brachial artery sonograms were obtained on a Vivid T8 (General Electrics, United States) sonography unit with a linear 5.0-MHz linear transducer. A pulsed Doppler volume of 1.2mm was obtained in the middle of the brachial artery with a maximum Doppler angle of 60°. Peak systolic and diastolic velocity, time-averaged flow velocity and time from onset to peak velocity (brachial acceleration time) were calculated.
Interobserver variabilityTo assess interobserver variability in physical examination variables, a second cardiologist, blinded to previous physical and echocardiographic findings, performed a complete physical examination in 20 patients (10 with severe and 10 with mild or moderate AS). For the study of variability, kappa index was used.
Statistical analysisContinuous variables are presented as mean±standard deviation and compared using the unpaired Student t-test. Categorical variables were expressed as percentages and compared using chi-square analysis or Fisher's exact test.
The comparison between quantitative variables was calculated by Pearson correlation.
We prospectively enrolled patients with AS diagnosed in our echocardiography laboratory since February 2018, which formed the validation group. The patients diagnosed between August 2017 and January 2018 constituted the derivation group.
A receiver-operator characteristic (ROC) curve was plotted in the derivation group for physical examination and brachial artery Doppler parameters to determine the best cut-off value for identifying severe AS. This cut-off value was determined as the value providing a balance between sensitivity and specificity. The area under the ROC curve was calculated. The calculated cut-off value was then tested in the validation cohort.
Differences were considered significant at P values <.05. For data analysis, the statistical program SPSS version 20.0 (SPSS Inc., United States) was used.
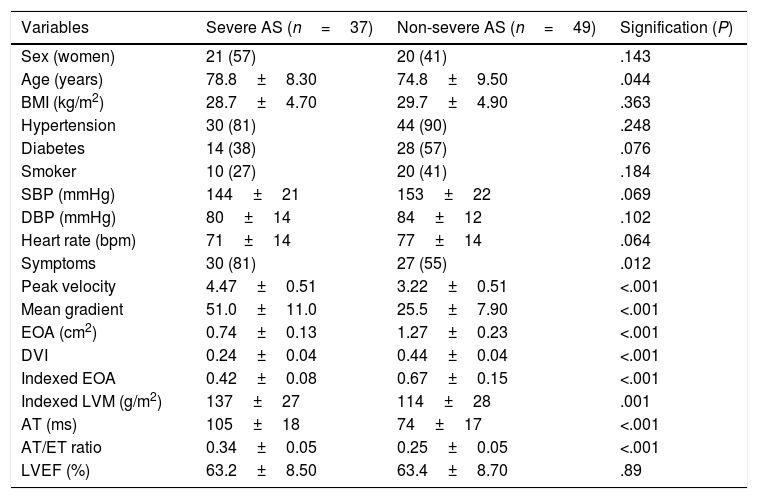
ResultsEighty-six patients were included (mean age 76.5±9.1 years, 48% women), of which 12 (14%) had mild AS, 37 (43%) moderate AS, and 37 (43%) severe AS, 95% of degenerative etiology. Basal characteristics of patients with severe and non-severe AS are summarized in Table 1. Patients with severe AS were significantly older and had higher prevalence of symptomatic patients.
Basal characteristics in patients with severe and non-severe AS.
| Variables | Severe AS (n=37) | Non-severe AS (n=49) | Signification (P) |
|---|---|---|---|
| Sex (women) | 21 (57) | 20 (41) | .143 |
| Age (years) | 78.8±8.30 | 74.8±9.50 | .044 |
| BMI (kg/m2) | 28.7±4.70 | 29.7±4.90 | .363 |
| Hypertension | 30 (81) | 44 (90) | .248 |
| Diabetes | 14 (38) | 28 (57) | .076 |
| Smoker | 10 (27) | 20 (41) | .184 |
| SBP (mmHg) | 144±21 | 153±22 | .069 |
| DBP (mmHg) | 80±14 | 84±12 | .102 |
| Heart rate (bpm) | 71±14 | 77±14 | .064 |
| Symptoms | 30 (81) | 27 (55) | .012 |
| Peak velocity | 4.47±0.51 | 3.22±0.51 | <.001 |
| Mean gradient | 51.0±11.0 | 25.5±7.90 | <.001 |
| EOA (cm2) | 0.74±0.13 | 1.27±0.23 | <.001 |
| DVI | 0.24±0.04 | 0.44±0.04 | <.001 |
| Indexed EOA | 0.42±0.08 | 0.67±0.15 | <.001 |
| Indexed LVM (g/m2) | 137±27 | 114±28 | .001 |
| AT (ms) | 105±18 | 74±17 | <.001 |
| AT/ET ratio | 0.34±0.05 | 0.25±0.05 | <.001 |
| LVEF (%) | 63.2±8.50 | 63.4±8.70 | .89 |
Data are expressed as no. (%) or mean±standard deviation. AS, aortic stenosis; AT, acceleration time; BMI, body mass index; bpm, beats per minute; DBP, diastolic blood pressure; DVI, Doppler velocity index; EOA, effective orifice area; ET, ejection time; LVEF, left ventricular ejection fraction; LVM, left ventricular mass; SBP, systolic blood pressure.
All subjects had an audible systolic murmur from grade 2 to 4. Murmur intensity (r=−0.32; P=.003) and duration (r=−0.54; P<.001) correlated with EOA (Fig. 1). Differences in physical examination variables between both groups are shown in Table 2.
Physical examination in patients with severe and non-severe AS.
| Variables | Severe AS (n=37) | Non-severe AS (n=49) | Signification (P) |
|---|---|---|---|
| Late systole murmur | 34 (92) | 17 (35) | <.001 |
| Grade 4 murmur | 6 (16) | 0 (0) | .01 |
| Second sound absent | 29 (78) | 4 (8) | <.001 |
| Neck irradiation | 37 (100) | 45 (92) | .131 |
| Apex irradiation | 36 (97) | 46 (94) | .631 |
| Gallavardin sign | 15 (40) | 7 (14) | .006 |
| Pulsus tardus >2 | 15 (40) | 0 (0) | <.001 |
| Pulsus parvus >2 | 16 (43) | 4 (8) | <.001 |
Data are expressed as no. (%). AS, aortic stenosis.
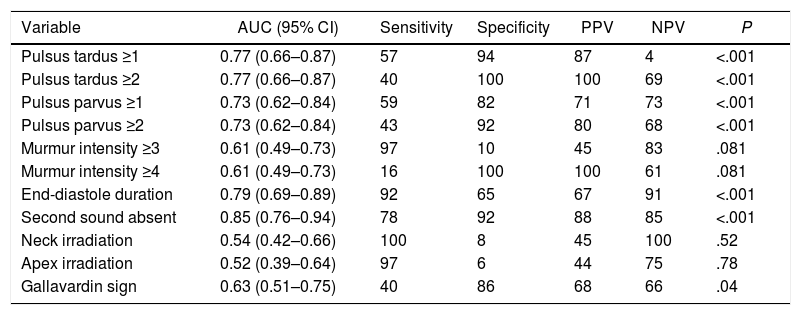
The area under the curve (AUC), sensitivity, specificity, negative and positive predictive values of physical examination findings for detection of severe AS were examined (Table 3). Note that some physical examination variables, such as murmur intensity higher than or equal to 4 or a delayed carotid upstroke (pulsus tardus ≥2) have a great specificity but with low sensitivity, whilst other variables have high sensitivity, such as murmur intensity ≥3 or irradiation to the apex or the neck. However, the physical examination findings with higher AUC were second heart sound absent (AUC 0.85, P<.001), late-systole murmur duration (AUC=0.79, P<.001) and pulsus tardus ≥2 (AUC=0.77, P<.001) for severe AS.
Area under the curve, sensitivity, specificity, and positive and negative predictive values for different physical examination findings to predict severe aortic stenosis.
| Variable | AUC (95% CI) | Sensitivity | Specificity | PPV | NPV | P |
|---|---|---|---|---|---|---|
| Pulsus tardus ≥1 | 0.77 (0.66–0.87) | 57 | 94 | 87 | 4 | <.001 |
| Pulsus tardus ≥2 | 0.77 (0.66–0.87) | 40 | 100 | 100 | 69 | <.001 |
| Pulsus parvus ≥1 | 0.73 (0.62–0.84) | 59 | 82 | 71 | 73 | <.001 |
| Pulsus parvus ≥2 | 0.73 (0.62–0.84) | 43 | 92 | 80 | 68 | <.001 |
| Murmur intensity ≥3 | 0.61 (0.49–0.73) | 97 | 10 | 45 | 83 | .081 |
| Murmur intensity ≥4 | 0.61 (0.49–0.73) | 16 | 100 | 100 | 61 | .081 |
| End-diastole duration | 0.79 (0.69–0.89) | 92 | 65 | 67 | 91 | <.001 |
| Second sound absent | 0.85 (0.76–0.94) | 78 | 92 | 88 | 85 | <.001 |
| Neck irradiation | 0.54 (0.42–0.66) | 100 | 8 | 45 | 100 | .52 |
| Apex irradiation | 0.52 (0.39–0.64) | 97 | 6 | 44 | 75 | .78 |
| Gallavardin sign | 0.63 (0.51–0.75) | 40 | 86 | 68 | 66 | .04 |
95% CI, 95% confidence interval; AUC, area under the curve; PPV, positive predictive value; NPV, negative predictive value.
We also analyzed 30 patients with body mass index ≥30kg/m2, with similar AUC than the general sample: second heart absent (AUC=1.0, P=.004), late-systole murmur duration (AUC=0.71, P=.22), pulsus tardus (AUC=0.70, P=.24), pulsus parvus (AUC=0.70, P=.24), and Gallavardin sign (AUC=0.80, P=.09).
Pulsus tardus >2 was associated with higher aortic peak velocity (4.6±0.5 vs 3.6±0.7m/s; P<.001), mean gradient (52.8±11.1 vs 33.2±14.1mmHg; P<.001), acceleration time (104±25 vs 84±22ms; P=.002), AT/ET ratio (0.35±0.05 vs 0.27±0.06; P<.001), indexed left ventricular mass (141±20 vs 120±30g/m2; P=.003) and lower EOA (0.76±0.14 vs 1.1±0.32cm2; P<.001) and indexed EOA (0.43±0.08 vs 0.60±0.18cm2/m2; P<.001).
Brachial artery DopplerBrachial artery AT was higher in more severe AS. We also found a non-significant trend to lower peak systolic velocity in patients with more severe AS (Table 4). A ROC curve was plotted to evaluate the optimal cut-off point in brachial AT for detecting severe AS (Fig. 2): AT had an AUC of 0.71 (0.55–0.83, P<.001), and a cut-off value of 84ms had the better balance between sensitivity and specificity.
Brachial artery Doppler in patients with severe and non-severe AS.
| Variables | Severe AS (n=37) | Non-severe AS (n=49) | P |
|---|---|---|---|
| AT (ms) | 81.9 (25.1) | 62.3 (19.7) | .006 |
| Systolic velocity (cm/s) | 50.1 (23.9) | 66.0 (27.3) | .05 |
| Diastolic velocity (cm/s) | 12.6 (7.0) | 14.5 (8.0) | .45 |
| Mean velocity (cm/s) | 30.4 (8.4) | 47.1 (30.2) | .33 |
| Pulsatility index | 1.23 (0.4) | 1.39 (0.3) | .19 |
Data are expressed as mean±standard deviation. AS, aortic stenosis; AT, acceleration time.
Validation group (58 patients) was composed by 32 patients (55%) with non-severe AS and 26 patients (45%) with severe AS. There were no significant differences in clinical basal characteristics with derivation group.
In the validation group, using a cut-off value of 84ms, it had a sensitivity of 46%, specificity of 87%, positive predictive value of 75% and negative predictive value of 67%. A cut-off value of 100ms had a specificity of 100% for severe AS. Using a cut-off value of 50ms in brachial arterial AT, the negative predictive value was 100% for severe AS.
A significant correlation was found between brachial AT and echocardiographic AT (r=0.46, P=.001), AT/ET ratio (r=0.47, P=.001) and semi-quantitative pulsus tardus (r=0.64, P<.001).
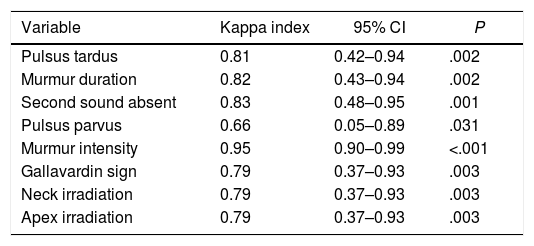
Interobserver variabilityThere was an acceptable correlation between the two observers in physical examination variables (Table 5). Physical findings with higher diagnostic accuracy for detecting severe AS showed a good interobserver variability: second heart sound absent (kappa index 0.83, P=.001), pulsus tardus (kappa index 0.81, P=.003) and murmur duration (kappa index 0.82, P=.002).
Interobserver variability in physical examination findings.
| Variable | Kappa index | 95% CI | P |
|---|---|---|---|
| Pulsus tardus | 0.81 | 0.42–0.94 | .002 |
| Murmur duration | 0.82 | 0.43–0.94 | .002 |
| Second sound absent | 0.83 | 0.48–0.95 | .001 |
| Pulsus parvus | 0.66 | 0.05–0.89 | .031 |
| Murmur intensity | 0.95 | 0.90–0.99 | <.001 |
| Gallavardin sign | 0.79 | 0.37–0.93 | .003 |
| Neck irradiation | 0.79 | 0.37–0.93 | .003 |
| Apex irradiation | 0.79 | 0.37–0.93 | .003 |
95% CI, 95% confidence interval.
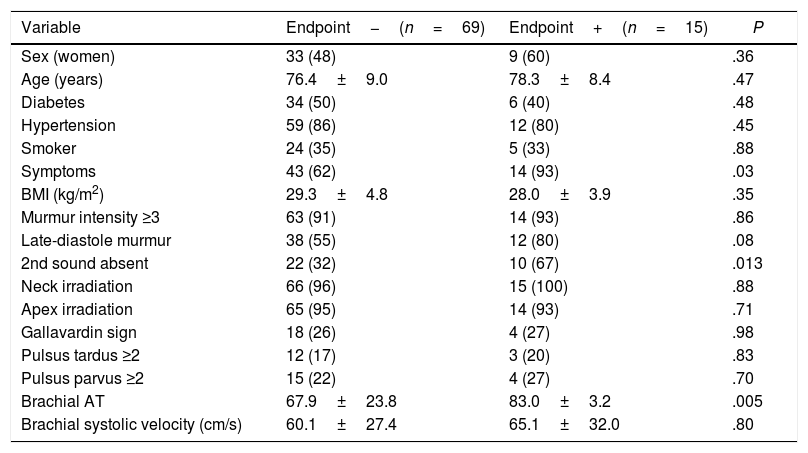
In this study, we have shown that physical examination findings of systolic murmur intensity, murmur duration, absence of second heart sound, Gallavardin sign, and a decreased and delayed carotid upstroke allowed us to discriminate severe AS assessed by Doppler echocardiography with good accuracy. In addition, absence of second heart sound is predictive of adverse clinical outcome (Table 6).
Univariate analysis of physical examination findings as predictors of clinical outcome.
| Variable | Endpoint−(n=69) | Endpoint+(n=15) | P |
|---|---|---|---|
| Sex (women) | 33 (48) | 9 (60) | .36 |
| Age (years) | 76.4±9.0 | 78.3±8.4 | .47 |
| Diabetes | 34 (50) | 6 (40) | .48 |
| Hypertension | 59 (86) | 12 (80) | .45 |
| Smoker | 24 (35) | 5 (33) | .88 |
| Symptoms | 43 (62) | 14 (93) | .03 |
| BMI (kg/m2) | 29.3±4.8 | 28.0±3.9 | .35 |
| Murmur intensity ≥3 | 63 (91) | 14 (93) | .86 |
| Late-diastole murmur | 38 (55) | 12 (80) | .08 |
| 2nd sound absent | 22 (32) | 10 (67) | .013 |
| Neck irradiation | 66 (96) | 15 (100) | .88 |
| Apex irradiation | 65 (95) | 14 (93) | .71 |
| Gallavardin sign | 18 (26) | 4 (27) | .98 |
| Pulsus tardus ≥2 | 12 (17) | 3 (20) | .83 |
| Pulsus parvus ≥2 | 15 (22) | 4 (27) | .70 |
| Brachial AT | 67.9±23.8 | 83.0±3.2 | .005 |
| Brachial systolic velocity (cm/s) | 60.1±27.4 | 65.1±32.0 | .80 |
Data are expressed as no. (%) or mean±standard deviation. AT, acceleration time; BMI, body mass index.
Although clinical history and physical examination are the primary methods for the evaluation of suspected AS,11 in previous studies the comparison between physical findings and severity of AS were based on cardiac catheterization,12 and carotid pulse tracing of phonocardiogram.13 Furthermore, most of the studies were conducted in 70s and 80s, when rheumatologic cause of AS was more frequent than nowadays,3 which might affect the findings of physical examination.
Our data are in agreement with previous studies comparing physical examination to Doppler echocardiography, although these patients had less severe AS11,14,15; or the studies included only asymptomatic severe AS patients,16 whilst we preferred using a sample more similar to the real population of AS. A systematic review of smaller studies17 showed that pulsus tardus, late peak intensity of the murmur and decreased intensity of the second heart sound were the most specific findings for AS, whilst absence of radiation to the neck had the highest negative predictive value, findings similar to those of our study.
We also studied the diagnostic value of physical examination in obese population, as the exploration of these patients presents difficulties. However, we did not find great differences in AUC in the obese population, although the small sample size must be underlined.
Definition of aortic stenosis severityAlthough other authors have used peak velocity as reference parameter of AS severity,14–16 in our study severe AS was defined as an EOA <1cm2 since peak velocity and mean gradient are flow-dependent and may be unrepresentative of the grade of AS at extremes of physiologic flow,18 according to current echocardiographic recommendations.10
However, it must be taken into account that there is not an ideal measure of AS severity because of the lack of a standard of reference in this heart valve disease.19,20
Pathophysiology of physical findings in aortic stenosisThe systolic murmur of AS is generated when blood passing through a narrowed orifice becomes turbulent. The characteristics of the murmur are determined by the velocity of the jet (that depends on AS severity), but also by direction of the jet and variable transmission of the sound through the chest wall.21
Absence of the second heart sound could be produced by a prolonged left ventricular ET in severe AS or severe calcification of aortic cusps leading to an inaudible aortic closure sound. Nevertheless, a split second heart sound could be heard in patients with severe AS and pulmonary hypertension, right ventricle conduction delay or non-severe calcification of aortic cusps.22
A pulsus parvus et tardus is a well-recognized clinical finding in severe AS.23 The prolonged carotid peak intensity may be due to delayed closing of aortic valve during ejection in severe AS24; this is in agreement with the correlation found in our study between AT and pulsus tardus. Pulsus parvus is due to a decreased stroke volume and it is a typical finding of severe AS.25
Brachial artery DopplerAlthough our aim was to demonstrate the diagnostic accuracy of physical examination in AS, these parameters have a subjective component. For assessing pulse alterations in an objective way, we decided to perform an artery Doppler study.
Although carotid pulse waveform may be affected by artery compliance, impedance, and reflected pressure waves, so coexisting hypertension or atherosclerosis may result in an early peak and normal amplitude carotid upstroke despite severe AS.26 Our data show that AT in brachial artery is higher as the AS is more severe, and there was a non-significant trend to a decreased peak systolic velocity in severe AS, similar to “subjective” physical examination findings.
One of the most important finding of our study was that an AT cut-off of 84ms in brachial artery Doppler has a high specificity for determining severe AS. To our knowledge, there are no studies that were able to establish a cut-off value for severe AS using a peripheral artery Doppler with an acceptable accuracy; that is, we could say that it is the first time that pulsus tardus has a cut-off value.
In our opinion, it could be useful to begin with the highest sensitivity parameters (murmur intensity ≥3 and neck irradiation) to discriminate patients who could be assess by echocardiography. On the other hand, we believe that high specificity parameters (pulsus tardus ≥2 or prolonged AT in brachial artery) could help to discriminate severe AS in case of discrepancies.
LimitationsSmall sample size must be underlined, so this could make difficult to reach another statistical differences. Another limitation is the short follow-up time, since there were few cardiovascular events to be able to find outcome predictors.
It could be argued that some parameters are subjective, but we demonstrated an acceptable interobserver correlation in physical examination findings. There is a wide confidence interval in all parameters because of the small sample size.
Our hospital is a reference center for echocardiography evaluation, so it is possible that a higher proportion of severe AS could be found in our sample. Therefore, caution should be taken in generalizing the results.
We decided to use brachial artery Doppler despite the fact that the central pressure curves differ from the peripheral artery,27 since carotid atherosclerosis is present in most patients with AS.28
ConclusionsIn conclusion, the present study shows that physical examination findings have an acceptable diagnostic accuracy for assessing AS severity. Although none of the physical examination variables have both a high sensitivity and specificity, it is probable that a combination of some of these could be useful for evaluating AS. Furthermore, prolongation of AT in brachial artery had a high specificity, so it could help to discriminate AS severity in case of discrepancies.
- -
Physical examination is useful for the diagnosis of aortic stenosis.
- -
The correlation between these physical findings and aortic stenosis severity is based on old studies, where rheumatic etiology was more frequent.
- -
The absence of second heart sound, late-systole murmur duration and the presence of pulsus tardus were the variables with the highest diagnostic accuracy.
- -
A cut-off value of 84ms for the acceleration time of the systolic flow in the brachial artery had a sensitivity of 46% and a specificity of 87% for severe AS.
There are no conflicts of interest.
Abbreviations: AS, aortic stenosis; AT, acceleration time; ET, ejection time; EOA, effective orifice area.


